Clinical Outcomes
CEA Fundamentals: Valuing Outcomes
Intro to QALYs
Origin story: welfare economics
- Utility = holistic measure of satisfaction or well-being
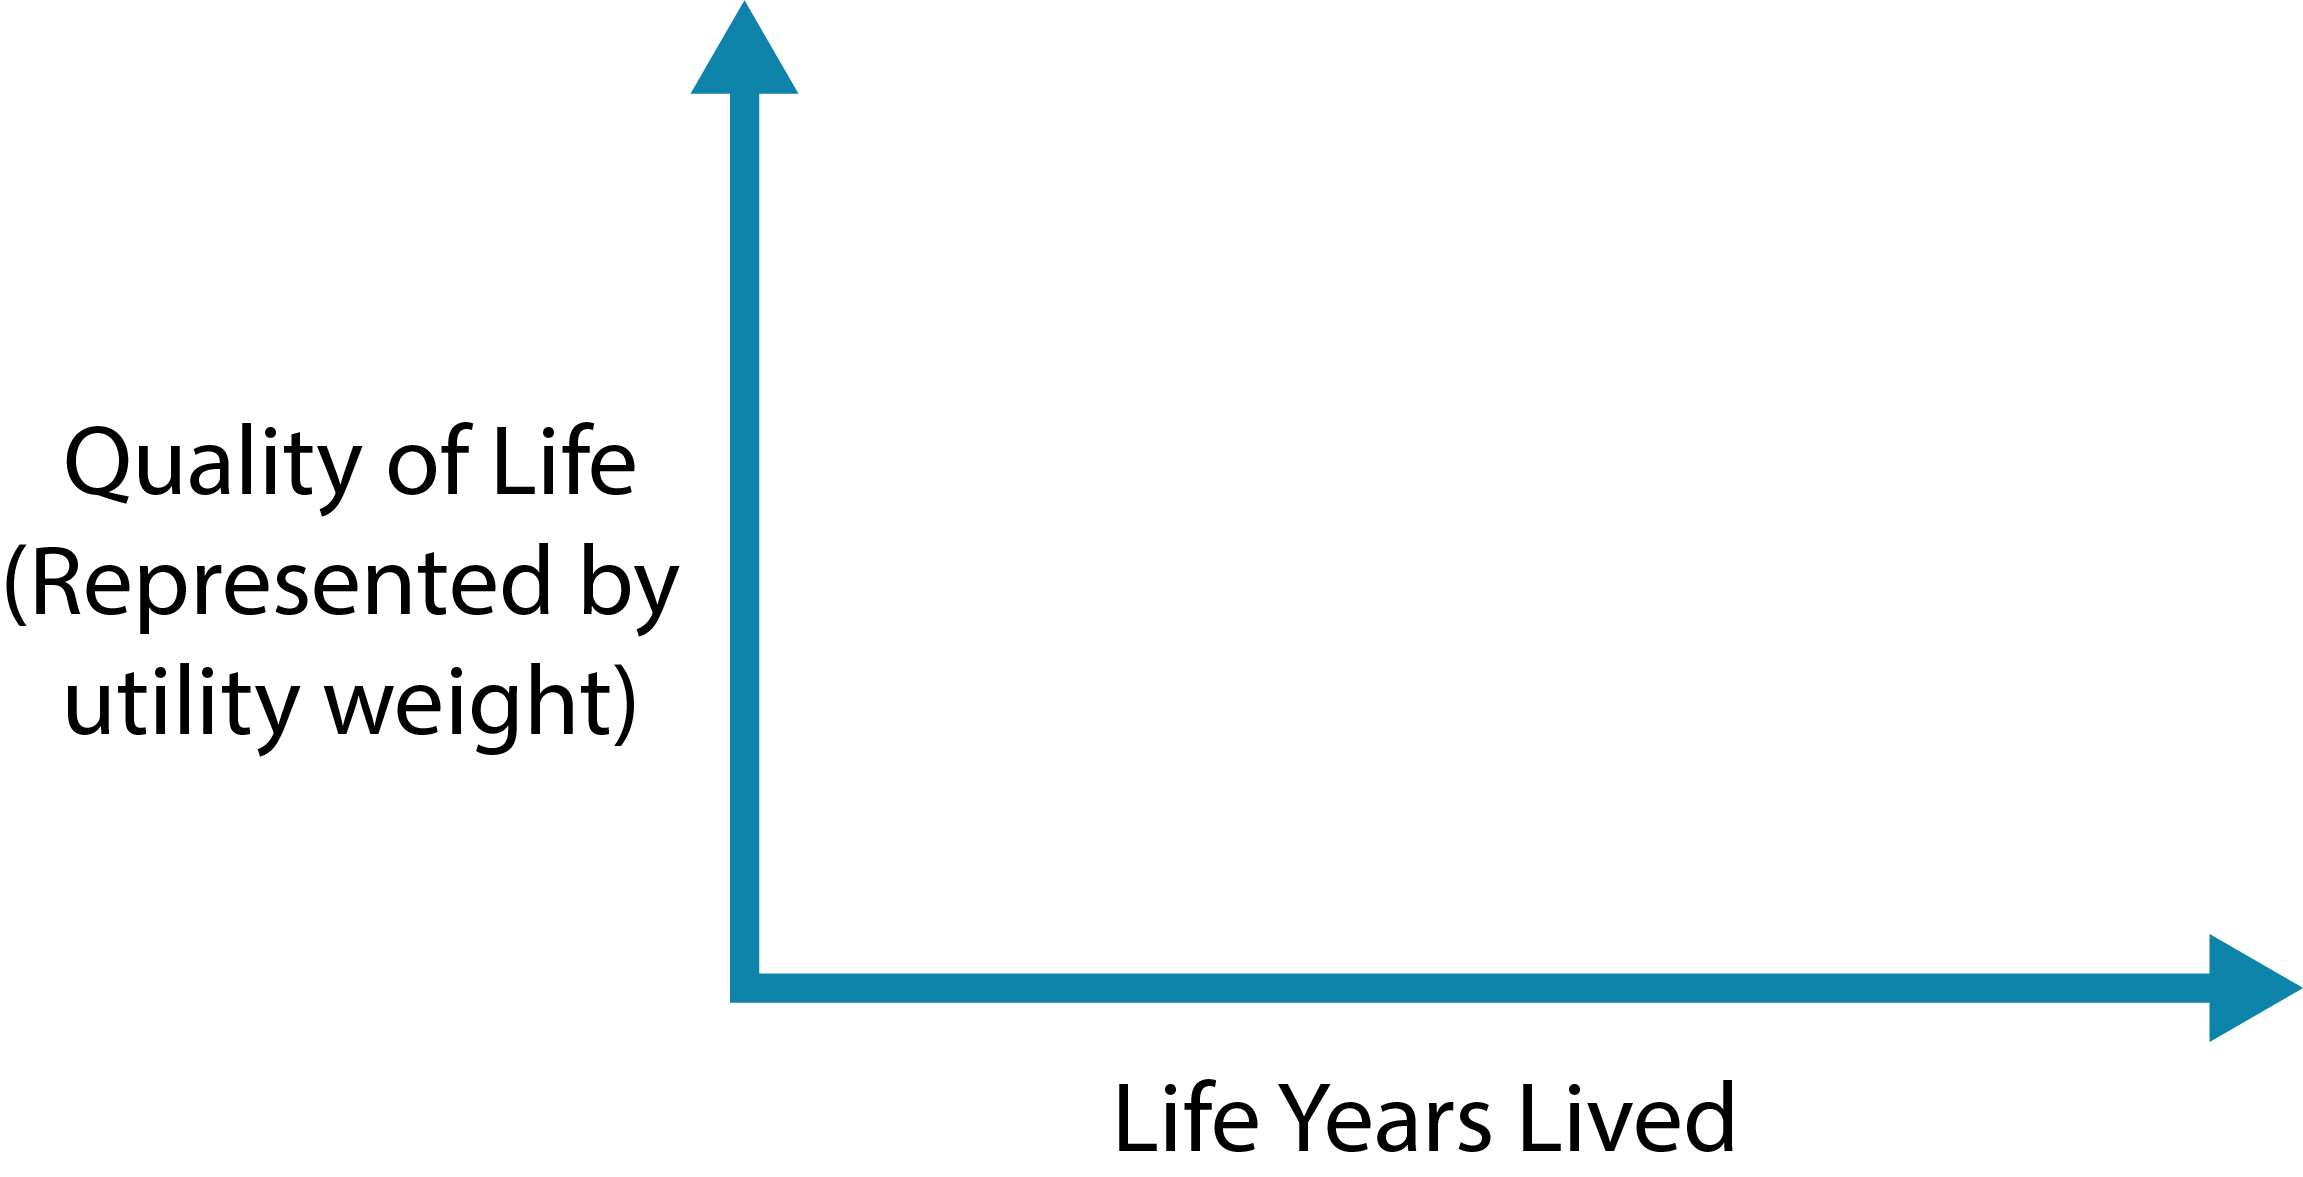
With QALYs, two dimensions of interest:
Length of life
measured in life-years
Quality of life
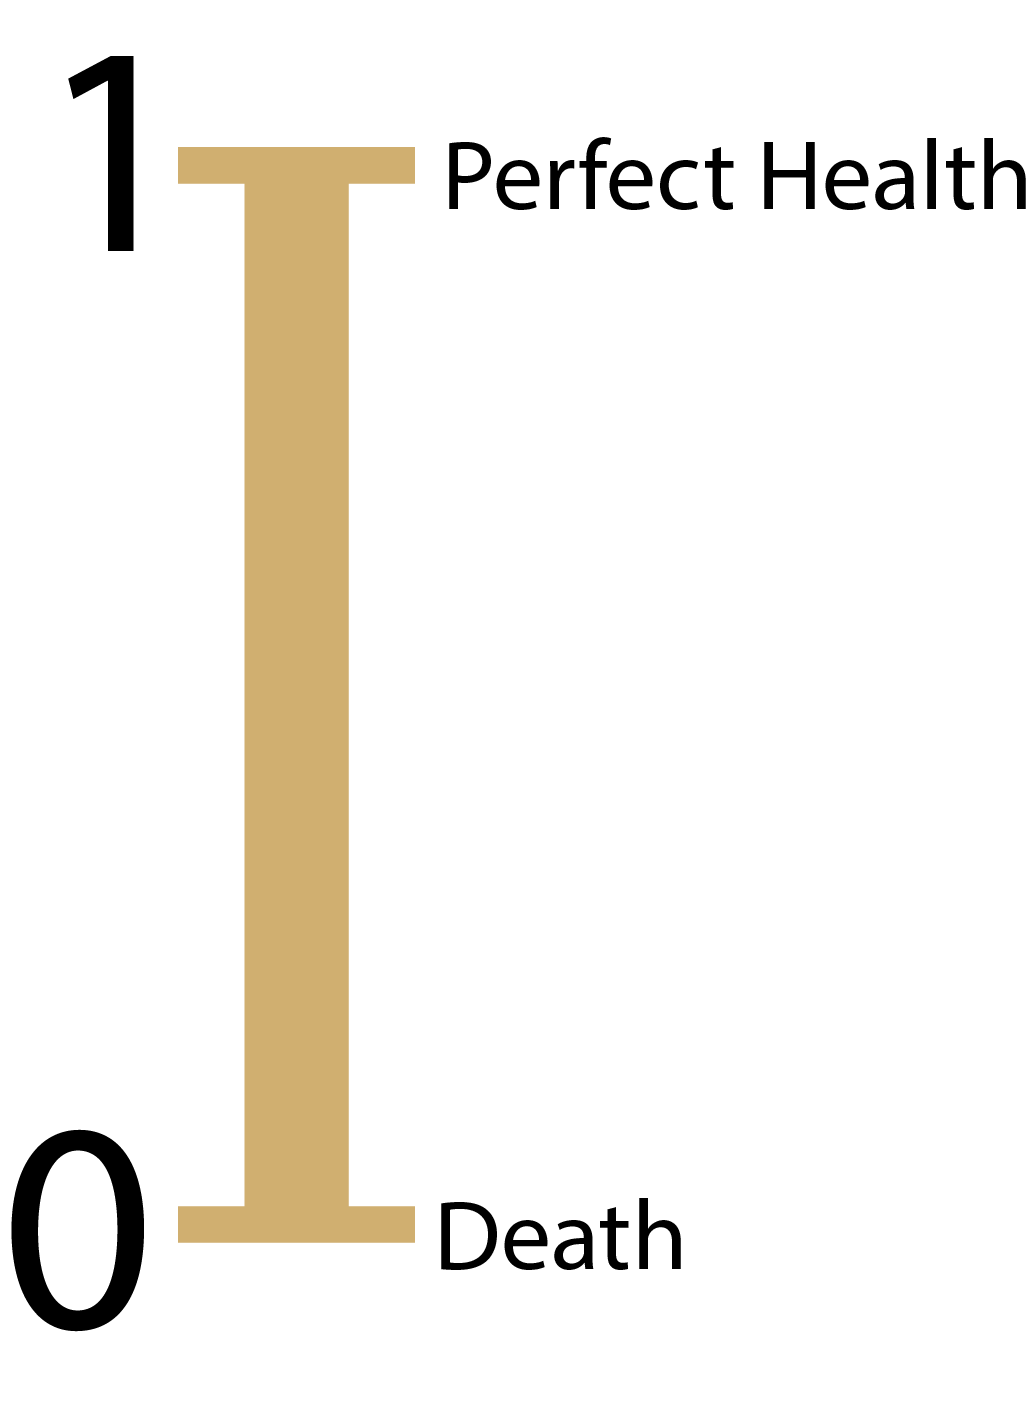
measured by utility weight, usually between 0 and 1
QALYs
A metric that reflects both changes in life expectancy and quality of life (pain, function, or both).
Formula:
Quality Adjusted Life Years =
Sum of weight * duration of life
Example: Patient with coronary heart disease (with surgery)
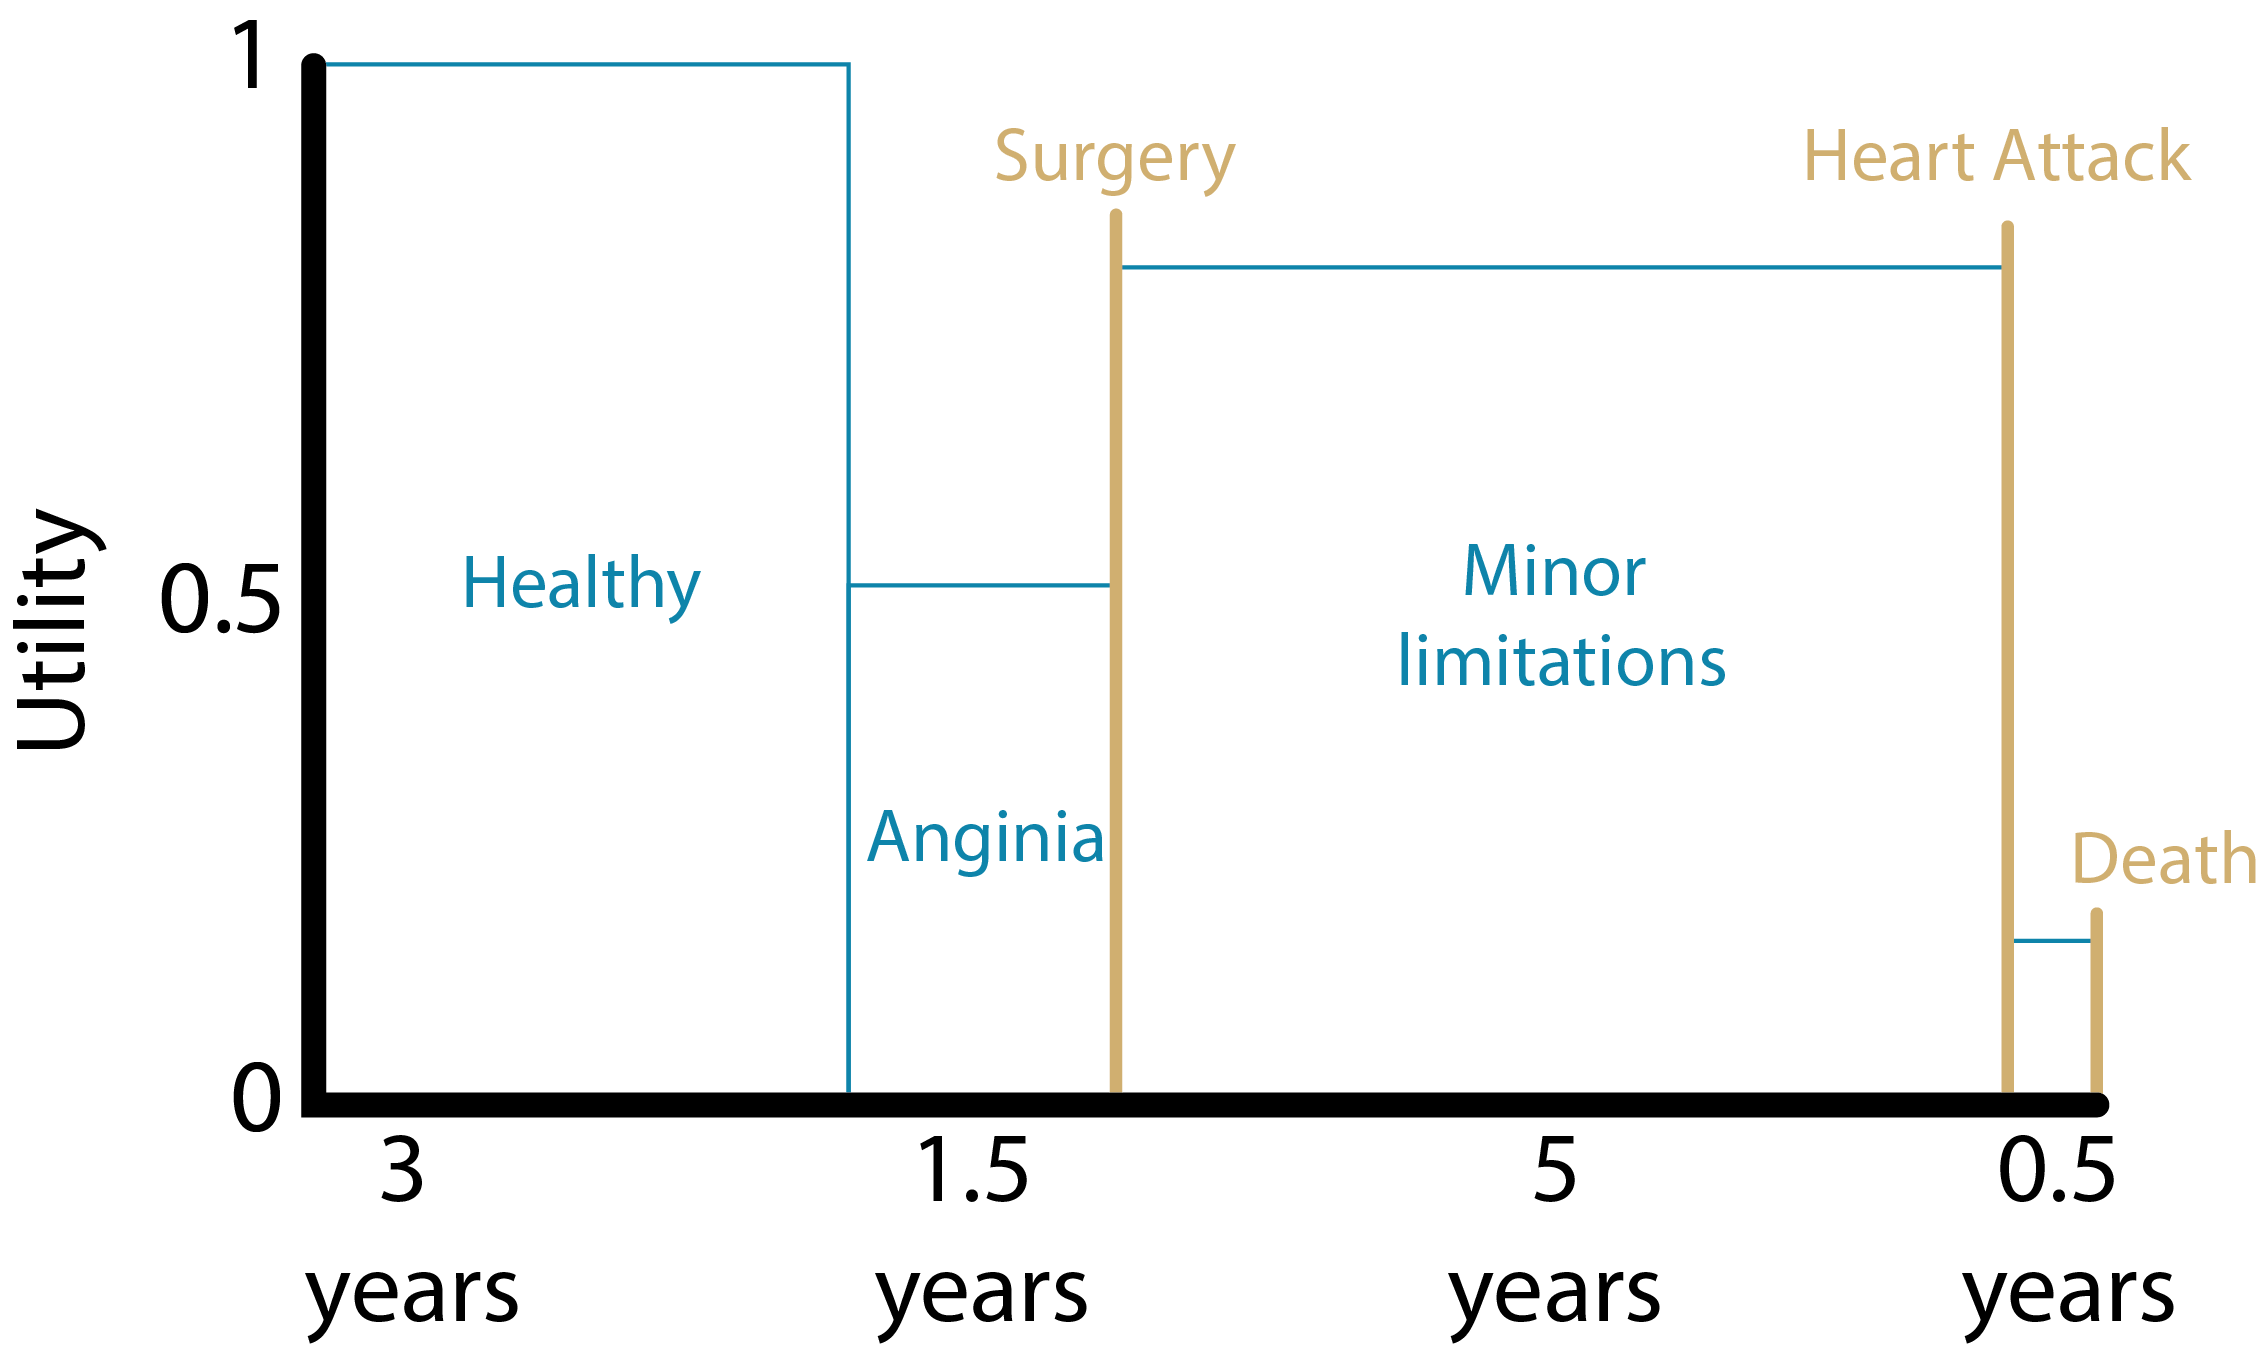
QALYS = (3yrs * 1.000) + (1.5yrs * 0.5) + (5yrs * 0.75) + (0.5yrs * 0.25)
= 7.625 QALYs
Source: Harvard Decision Science
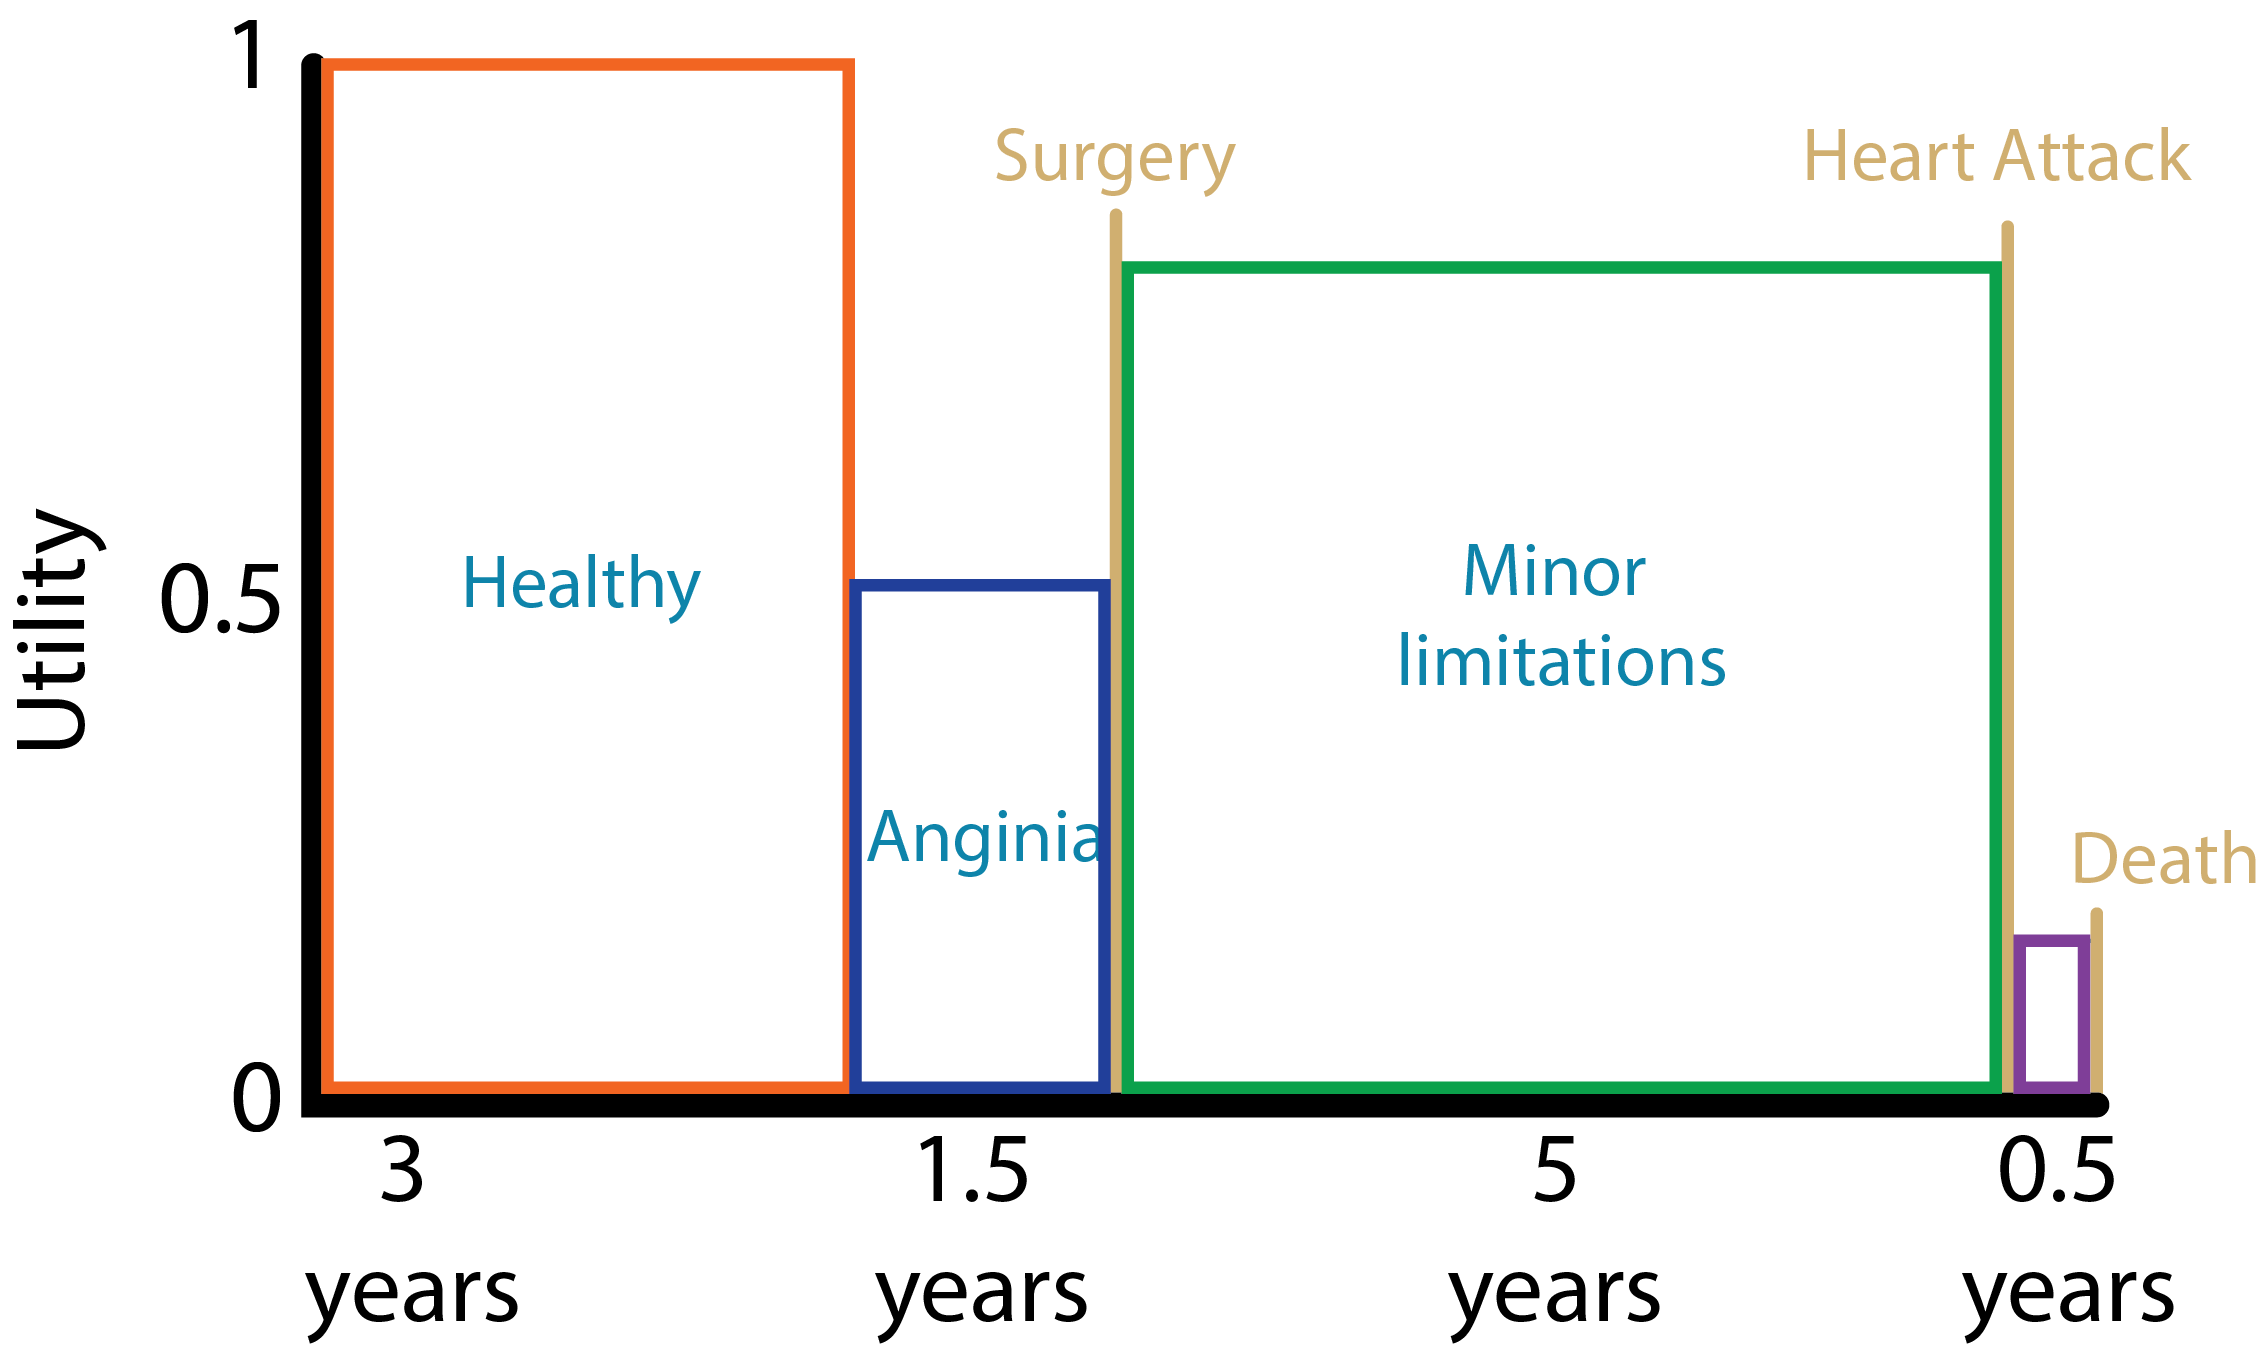
Example: Patient with coronary heart disease (without surgery)
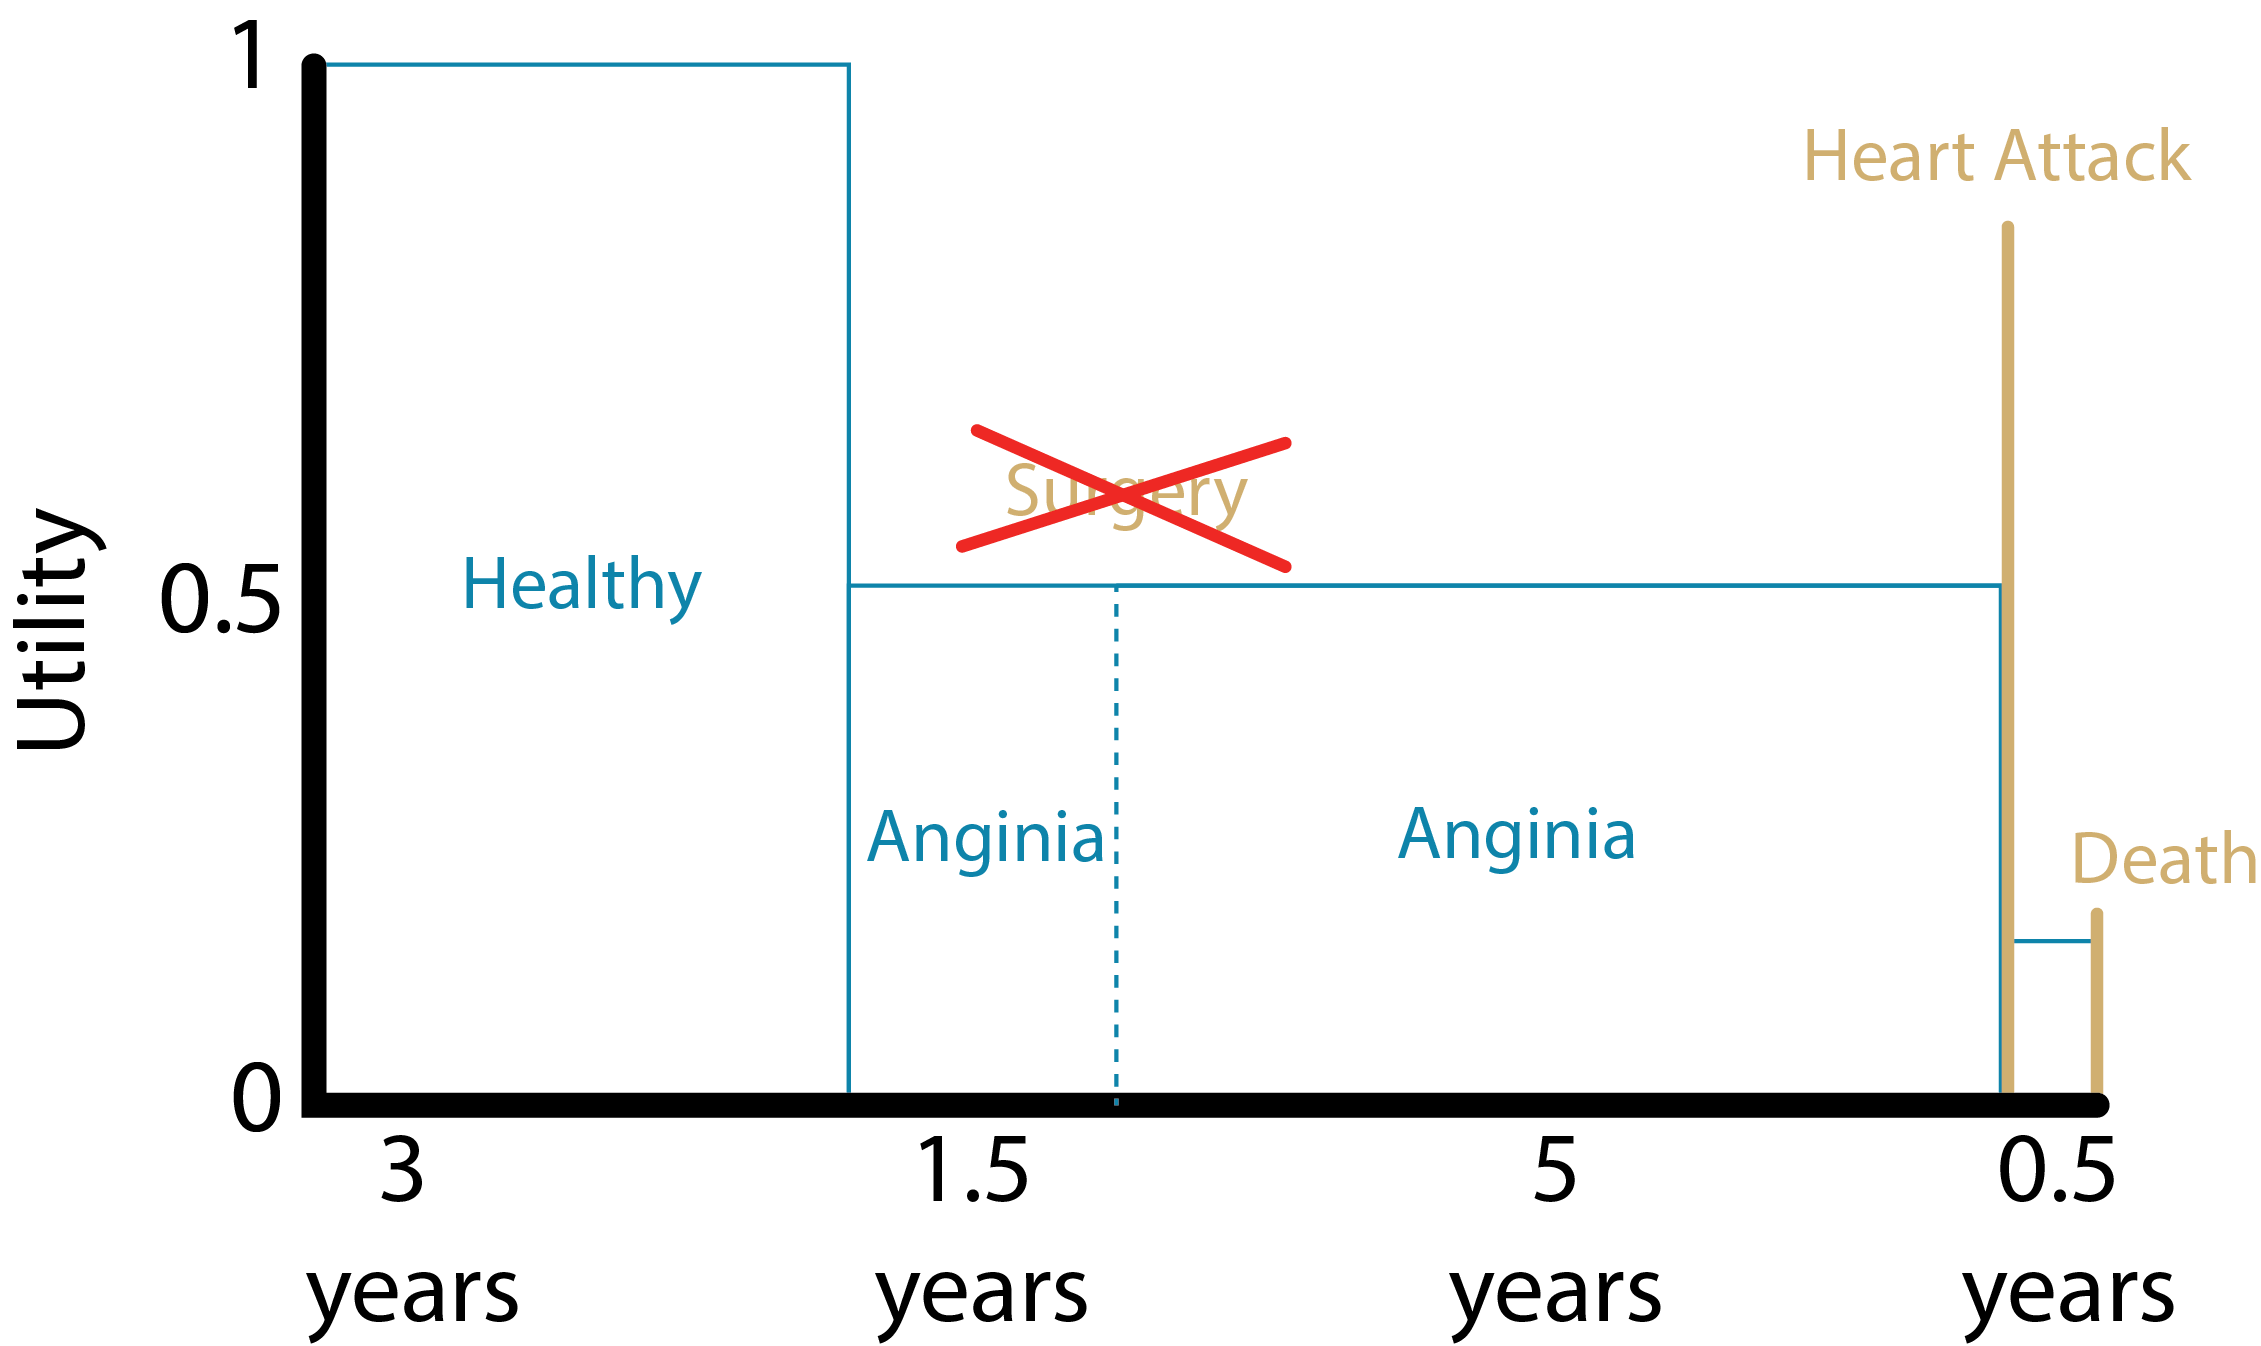
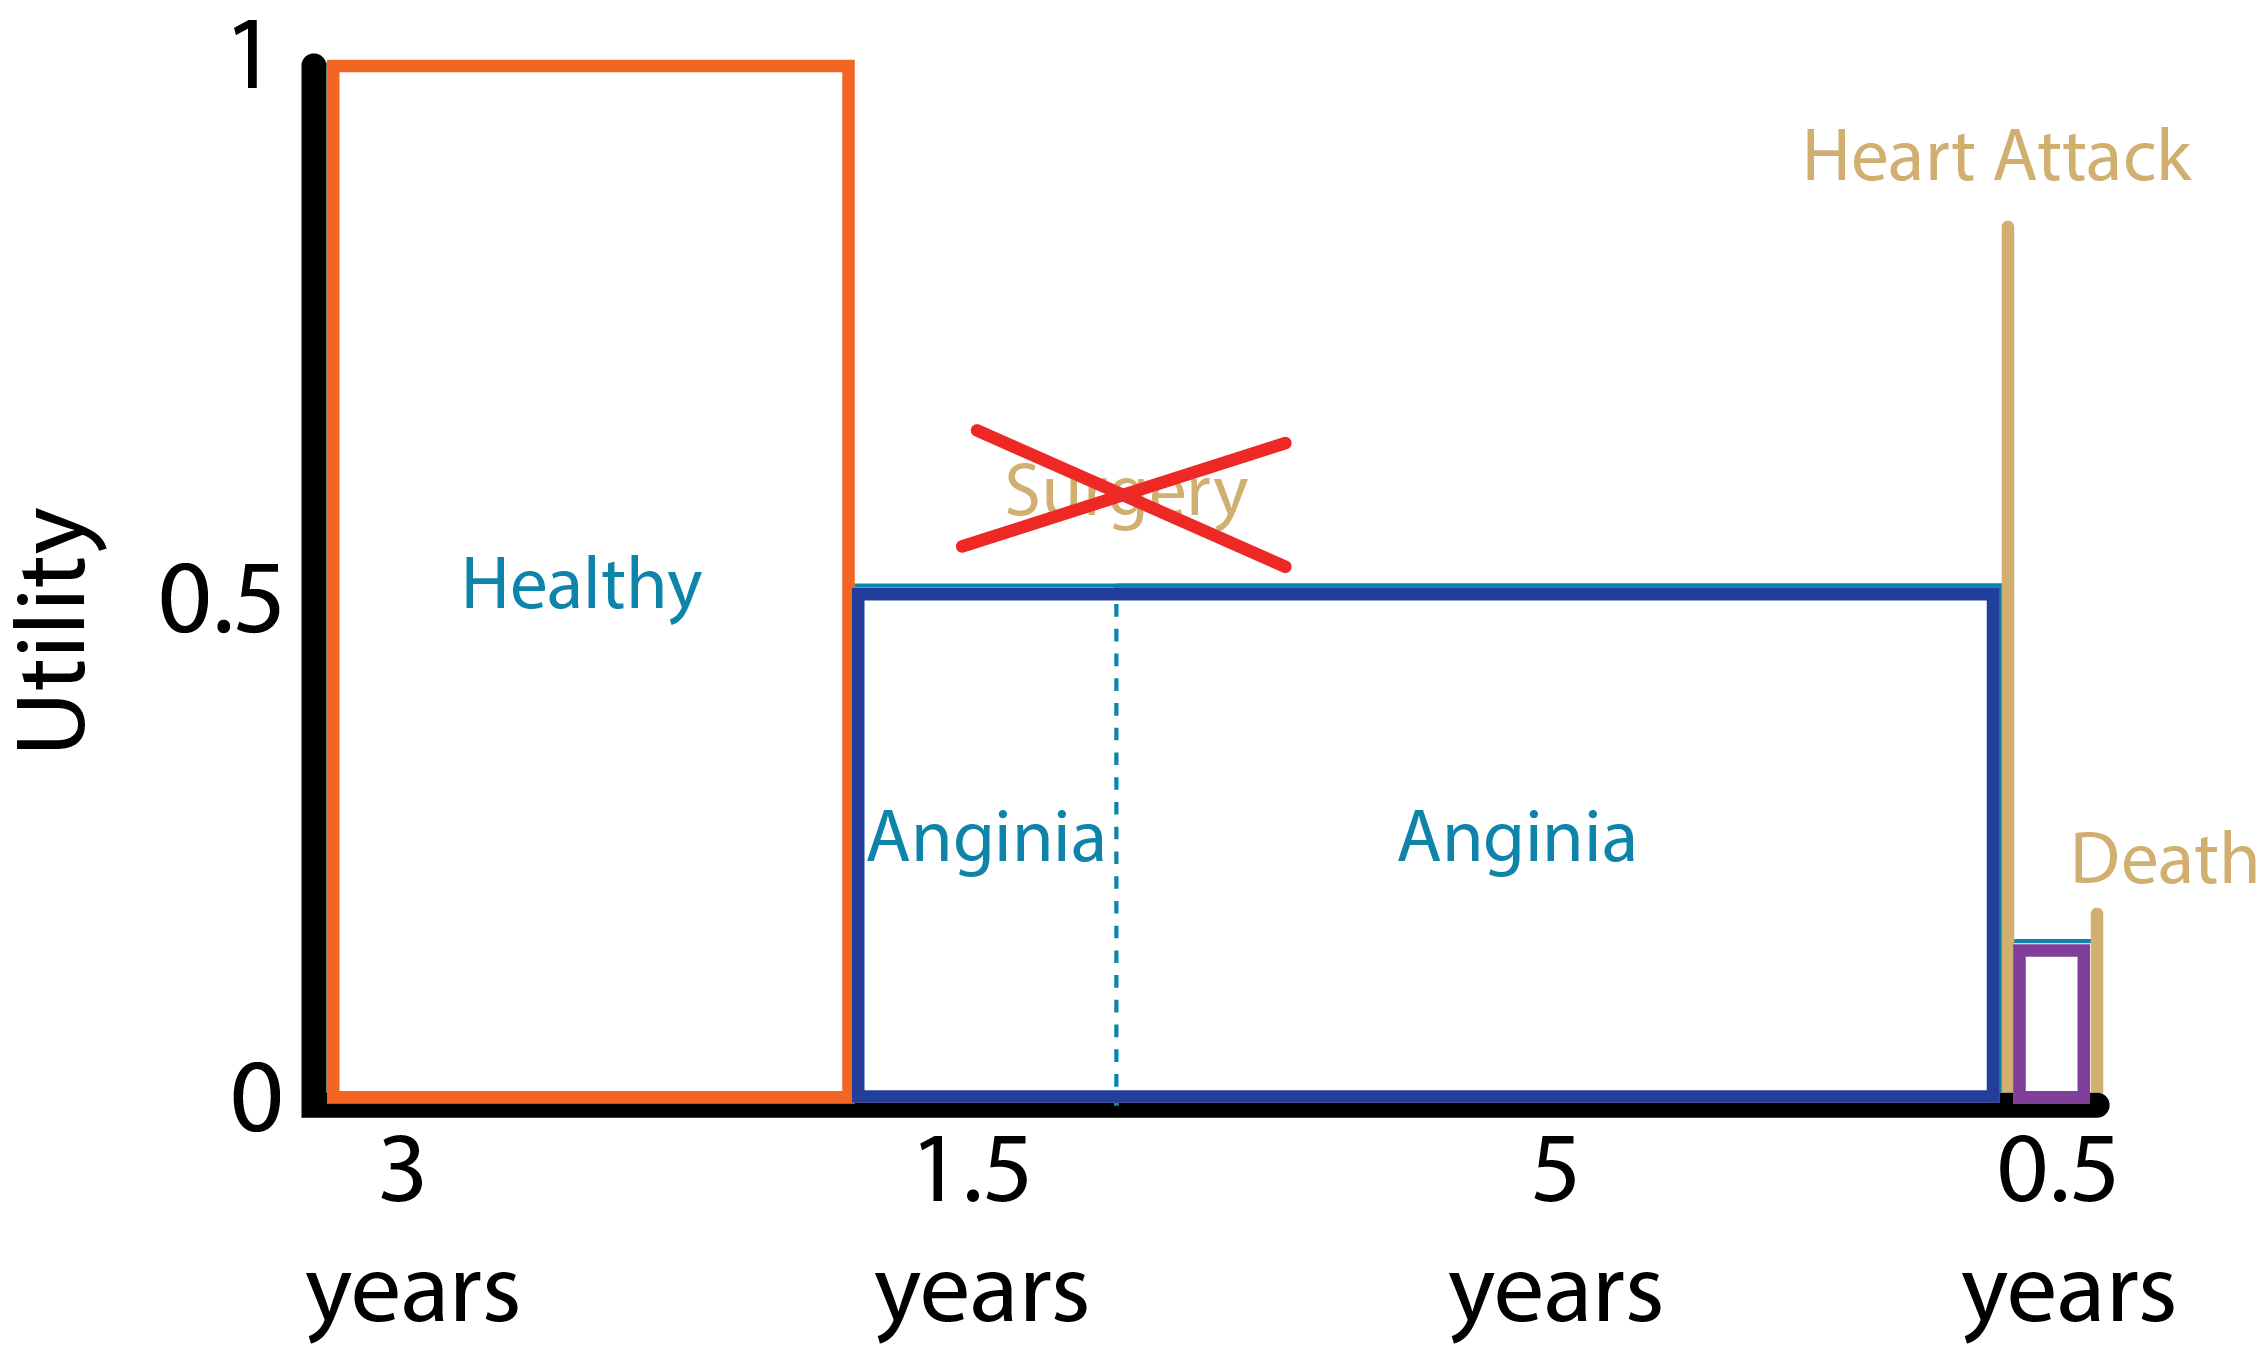
QALYS = (3yrs * 1.000) + (1.5yrs * 0.5) + (5yrs * 0.5) + (0.5yrs * 0.25)
= 6.375 QALYs
Source: Harvard Decision Science
Direct methods - Standard Gamble (SG)
What risk of death would you accept in order to avoid [living with an amputated leg for the rest of your life] and live the rest of your life in perfect health?
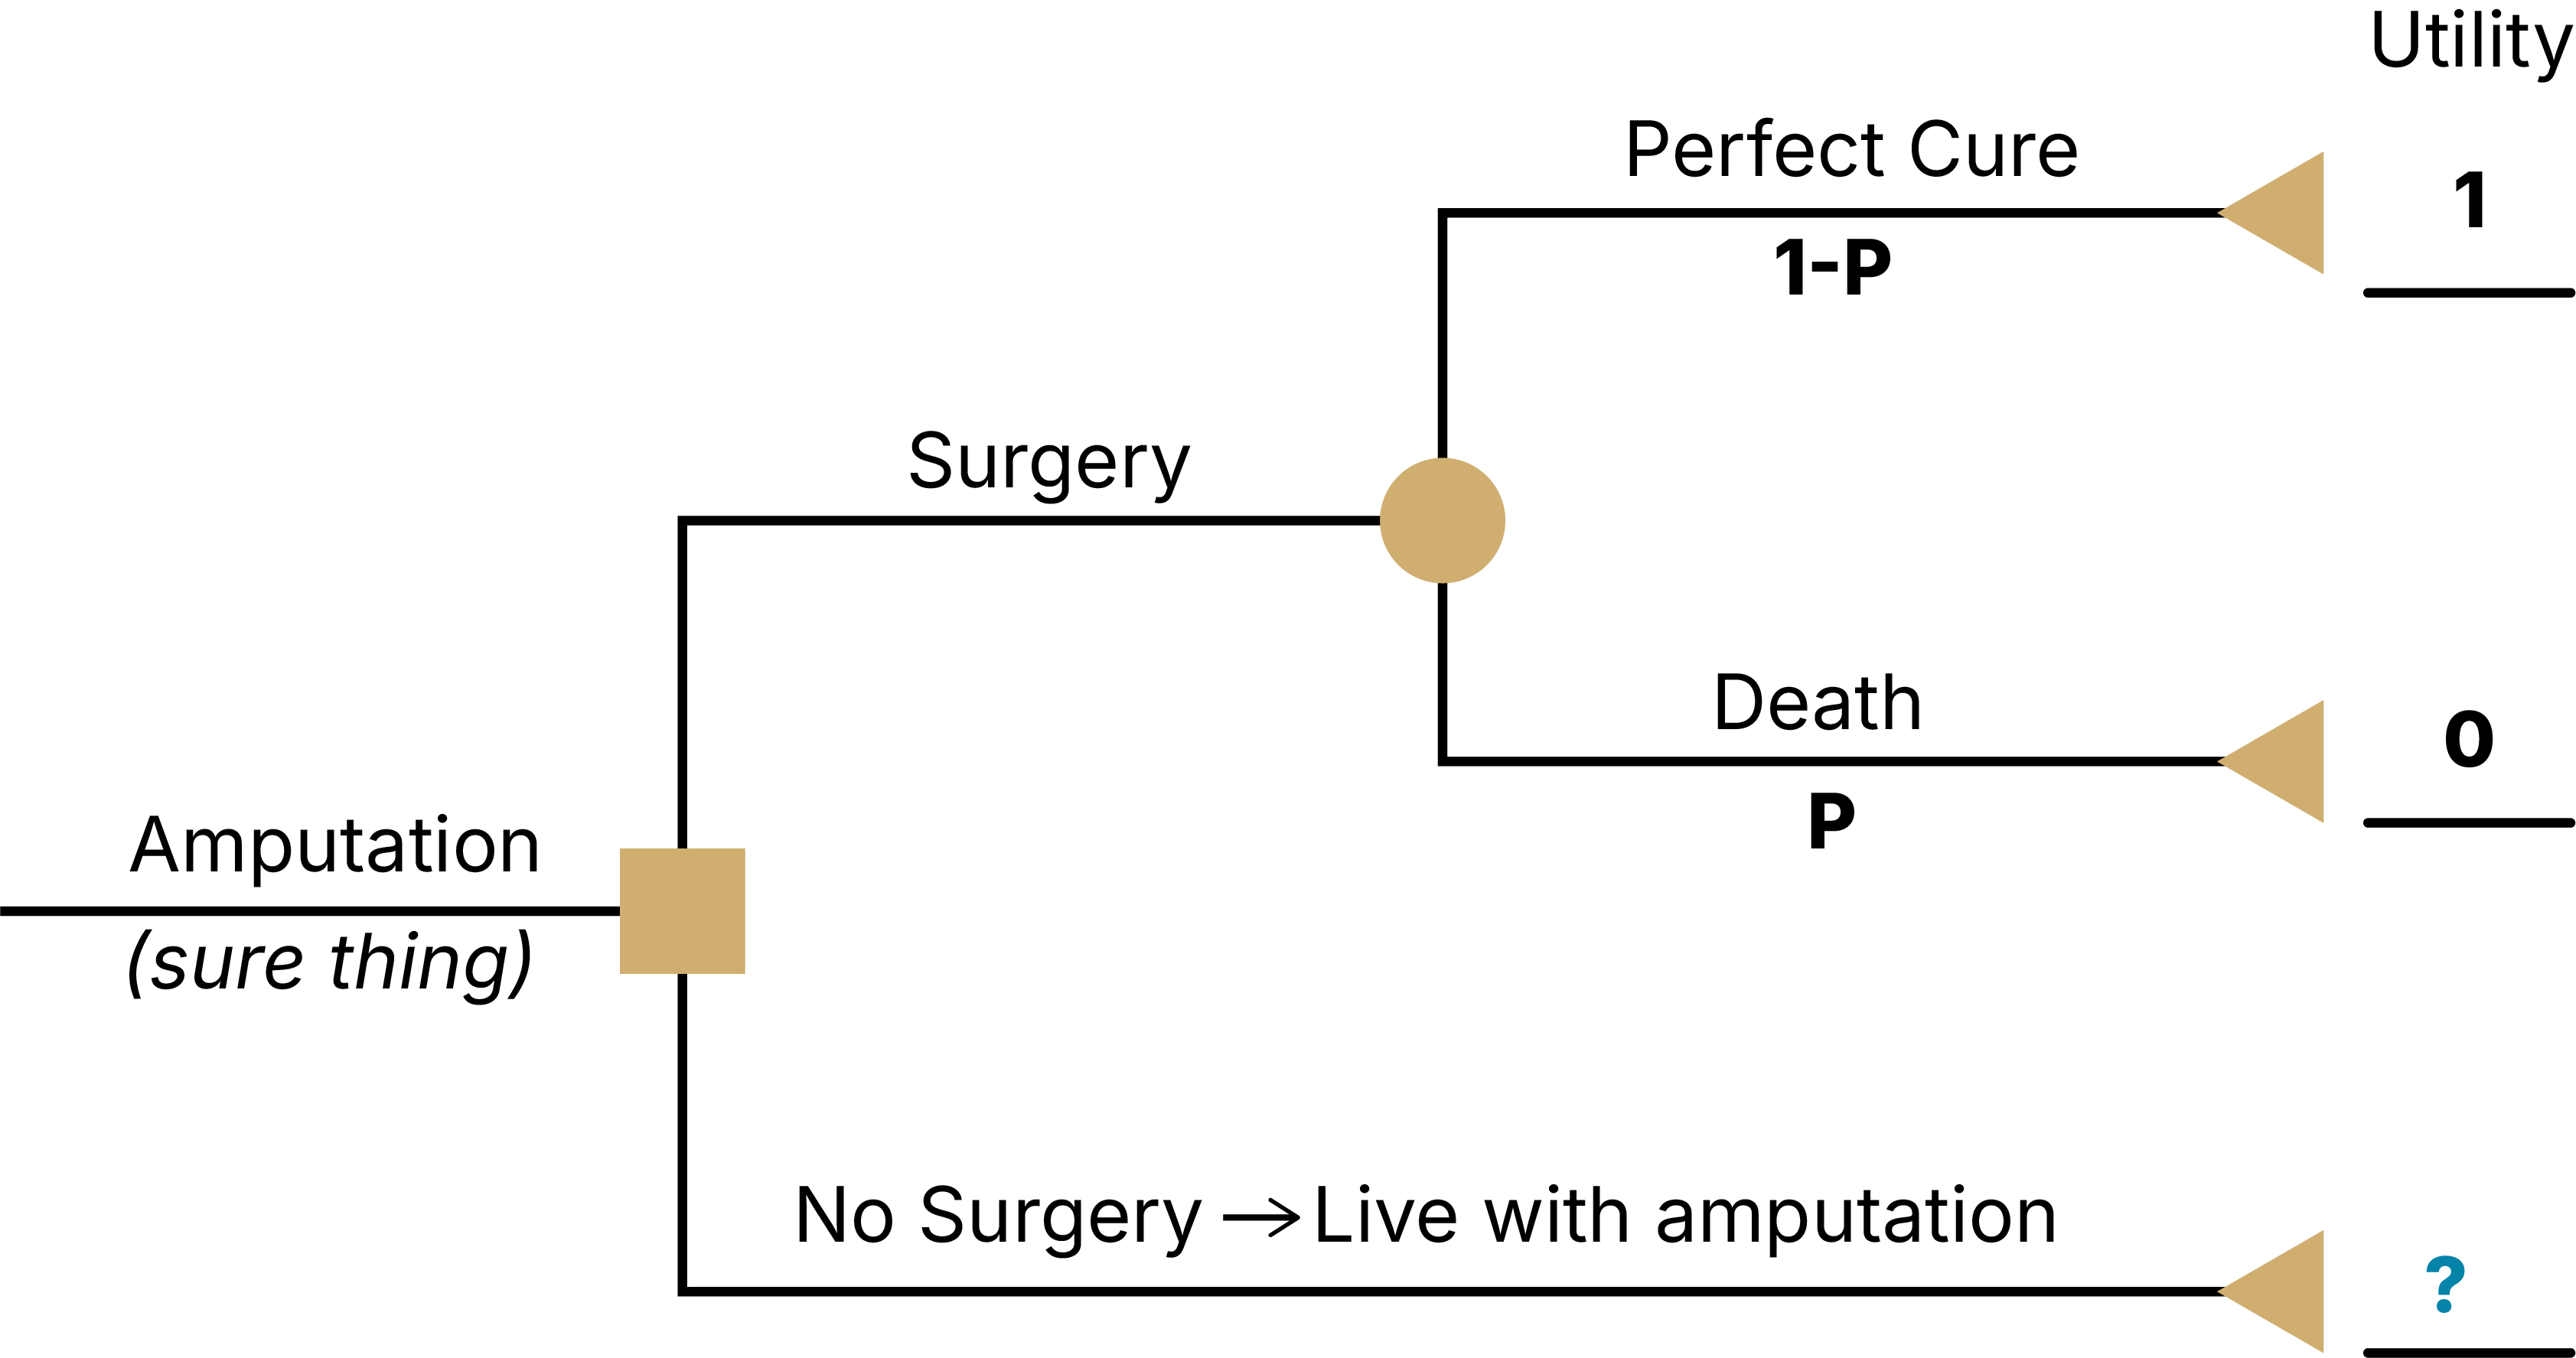
- Find the threshold p that sets EV(A) = EV(B)
- Assume respondent answered that they would be indifferent between A and B at a threshold of pDeath = 0.10
- Then U(Amputation) = p*U(Death) + (1-p)*U(Perfect Health) = 0.10*0 + (1-0.10)*1 = 0.9 = threshold of indifference between surgery & no surgery (I will live with this rather than have a high risk of dying)
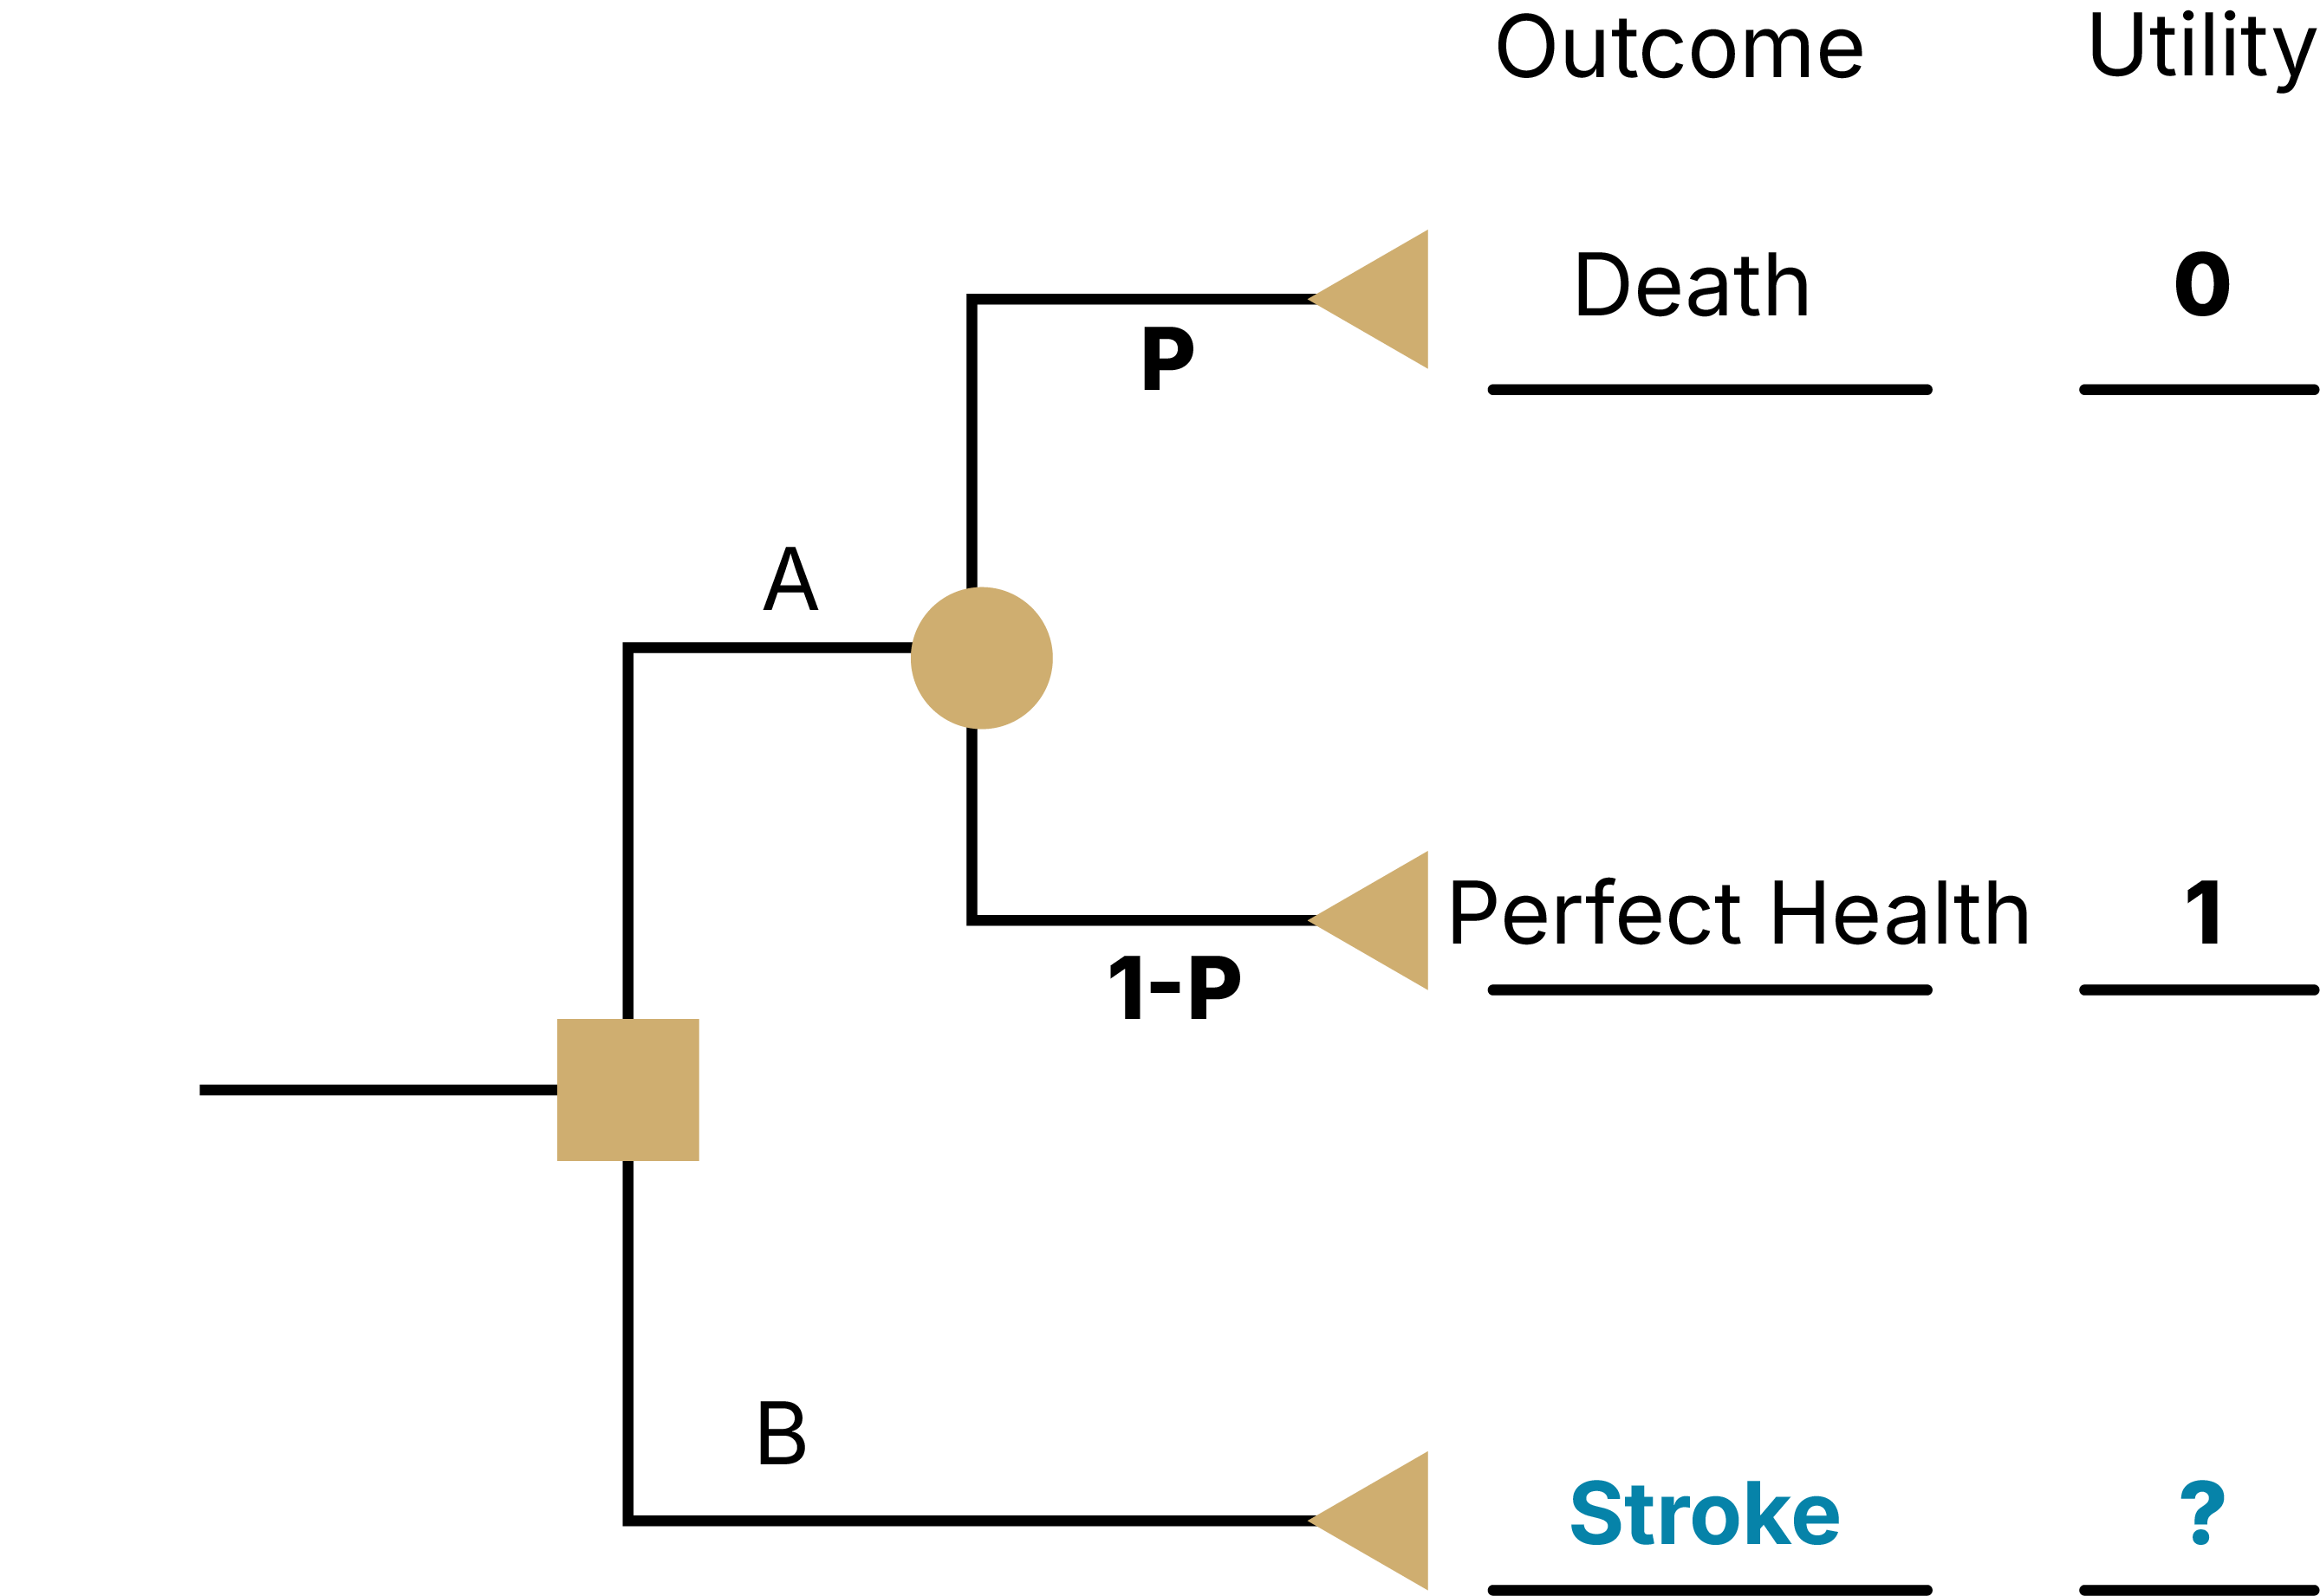
Direct methods - Standard Gamble (SG)
What risk of death would you accept in order to avoid [living with stroke for the rest of your life] and live the rest of your life in perfect health?
As a result of a stroke, you
Have impaired use of your left arm and leg
Need some help bathing and dressing
Need a cane or other device to walk
Experience mild pain a few days per week
Are able to work, with some modifications
Need assistance with shopping, household chores, errands
Feel anxious and depressed sometimes
Direct methods - Time Trade-Off (TTO)
What portion of your current life expectancy of 40 years would you give up to improve your current health state stroke to ‘perfect health’?
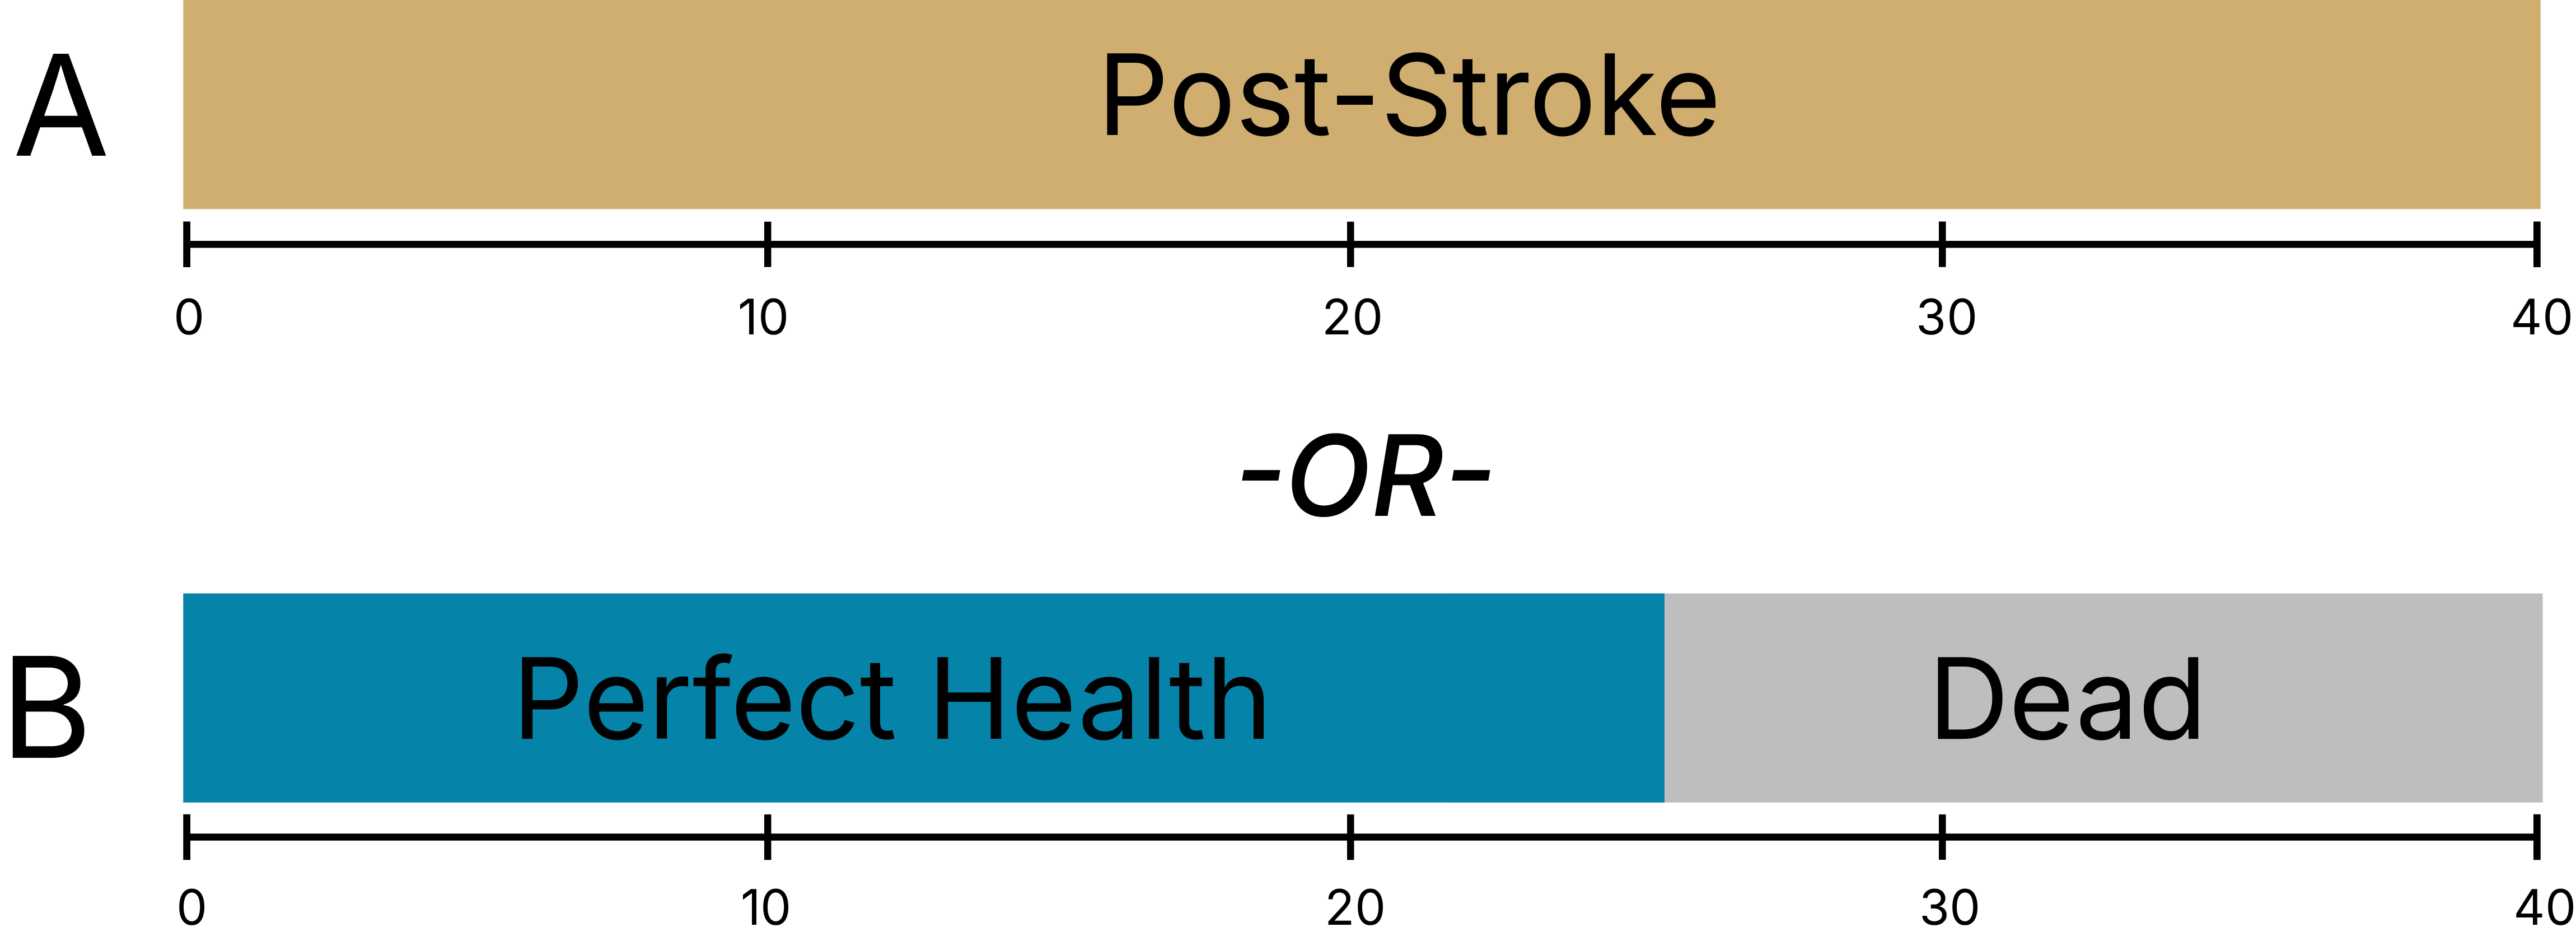
U(Post-Stroke) * 40 years = U(Perfect Health) * 25 years + U(Dead) * 15 years
U(Post-Stroke) * 40 years = 1 * 25 years + 0 * 15 years
U(Post-Stroke) = 25/40 = 0.625
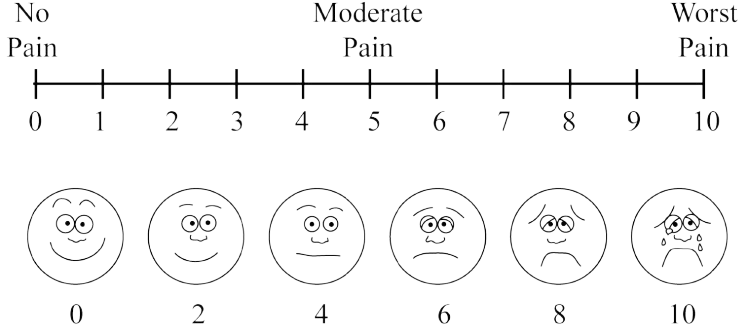
Visual Analogue Scale (VAS)
The Visual Analog Scale (VAS) is a commonly-used rating scale
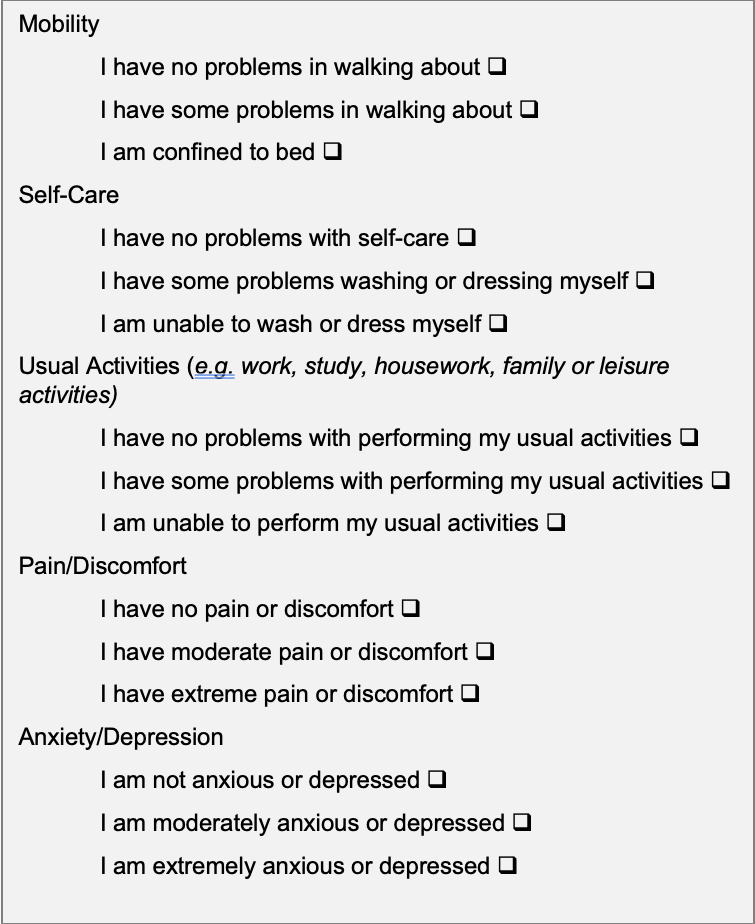
Indirect methods - EQ-5D
System for describing health states
5 domains: mobility; self-care; usual activities; pain/discomfort; and anxiety/depression
3 levels: 243 distinct health states (e.g. 11223)
Valuations elicited through population based surveys with VAS, TTO
NHB/NMB
The strategy with the highest incremental NHB or NMB is the preferred option, given a specified WTP threshold.
A higher NHB means more health gained after accounting for costs.