Review of CEA ratio
Incremental Cost-Effectiveness Analysis
Treat All vs. Treat None
Strategy: Treat All 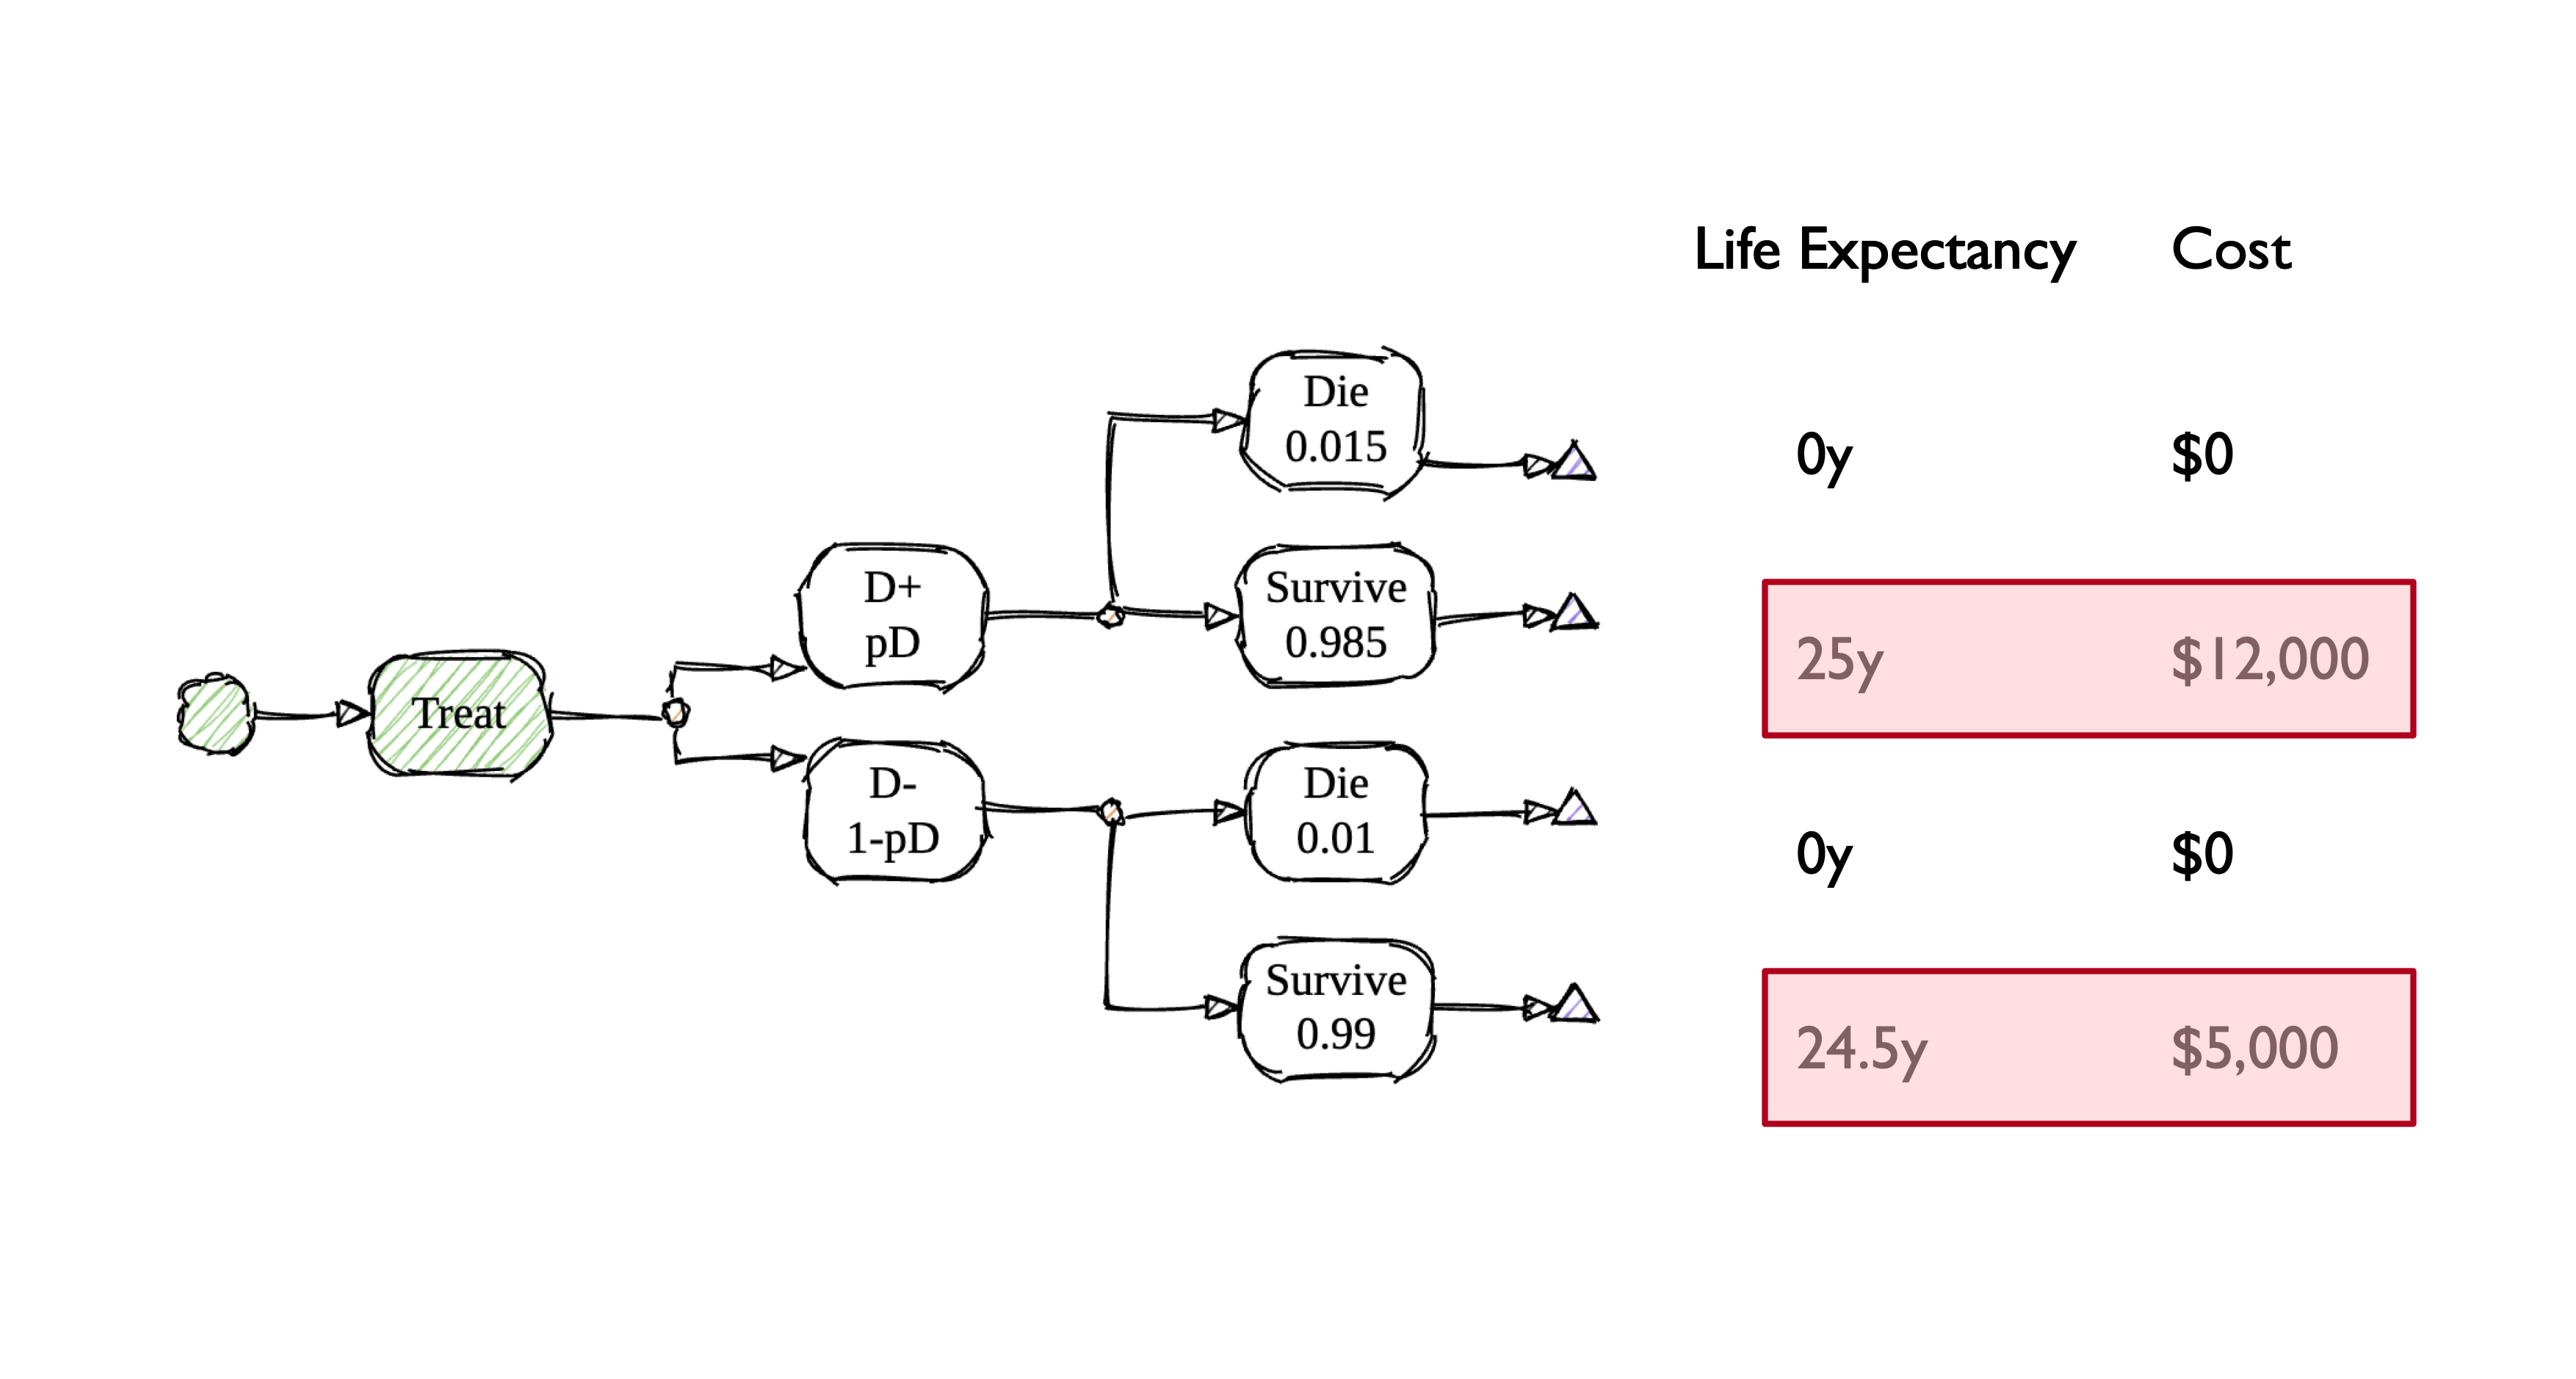
Treat All vs. Treat None
Strategy: Treat No One 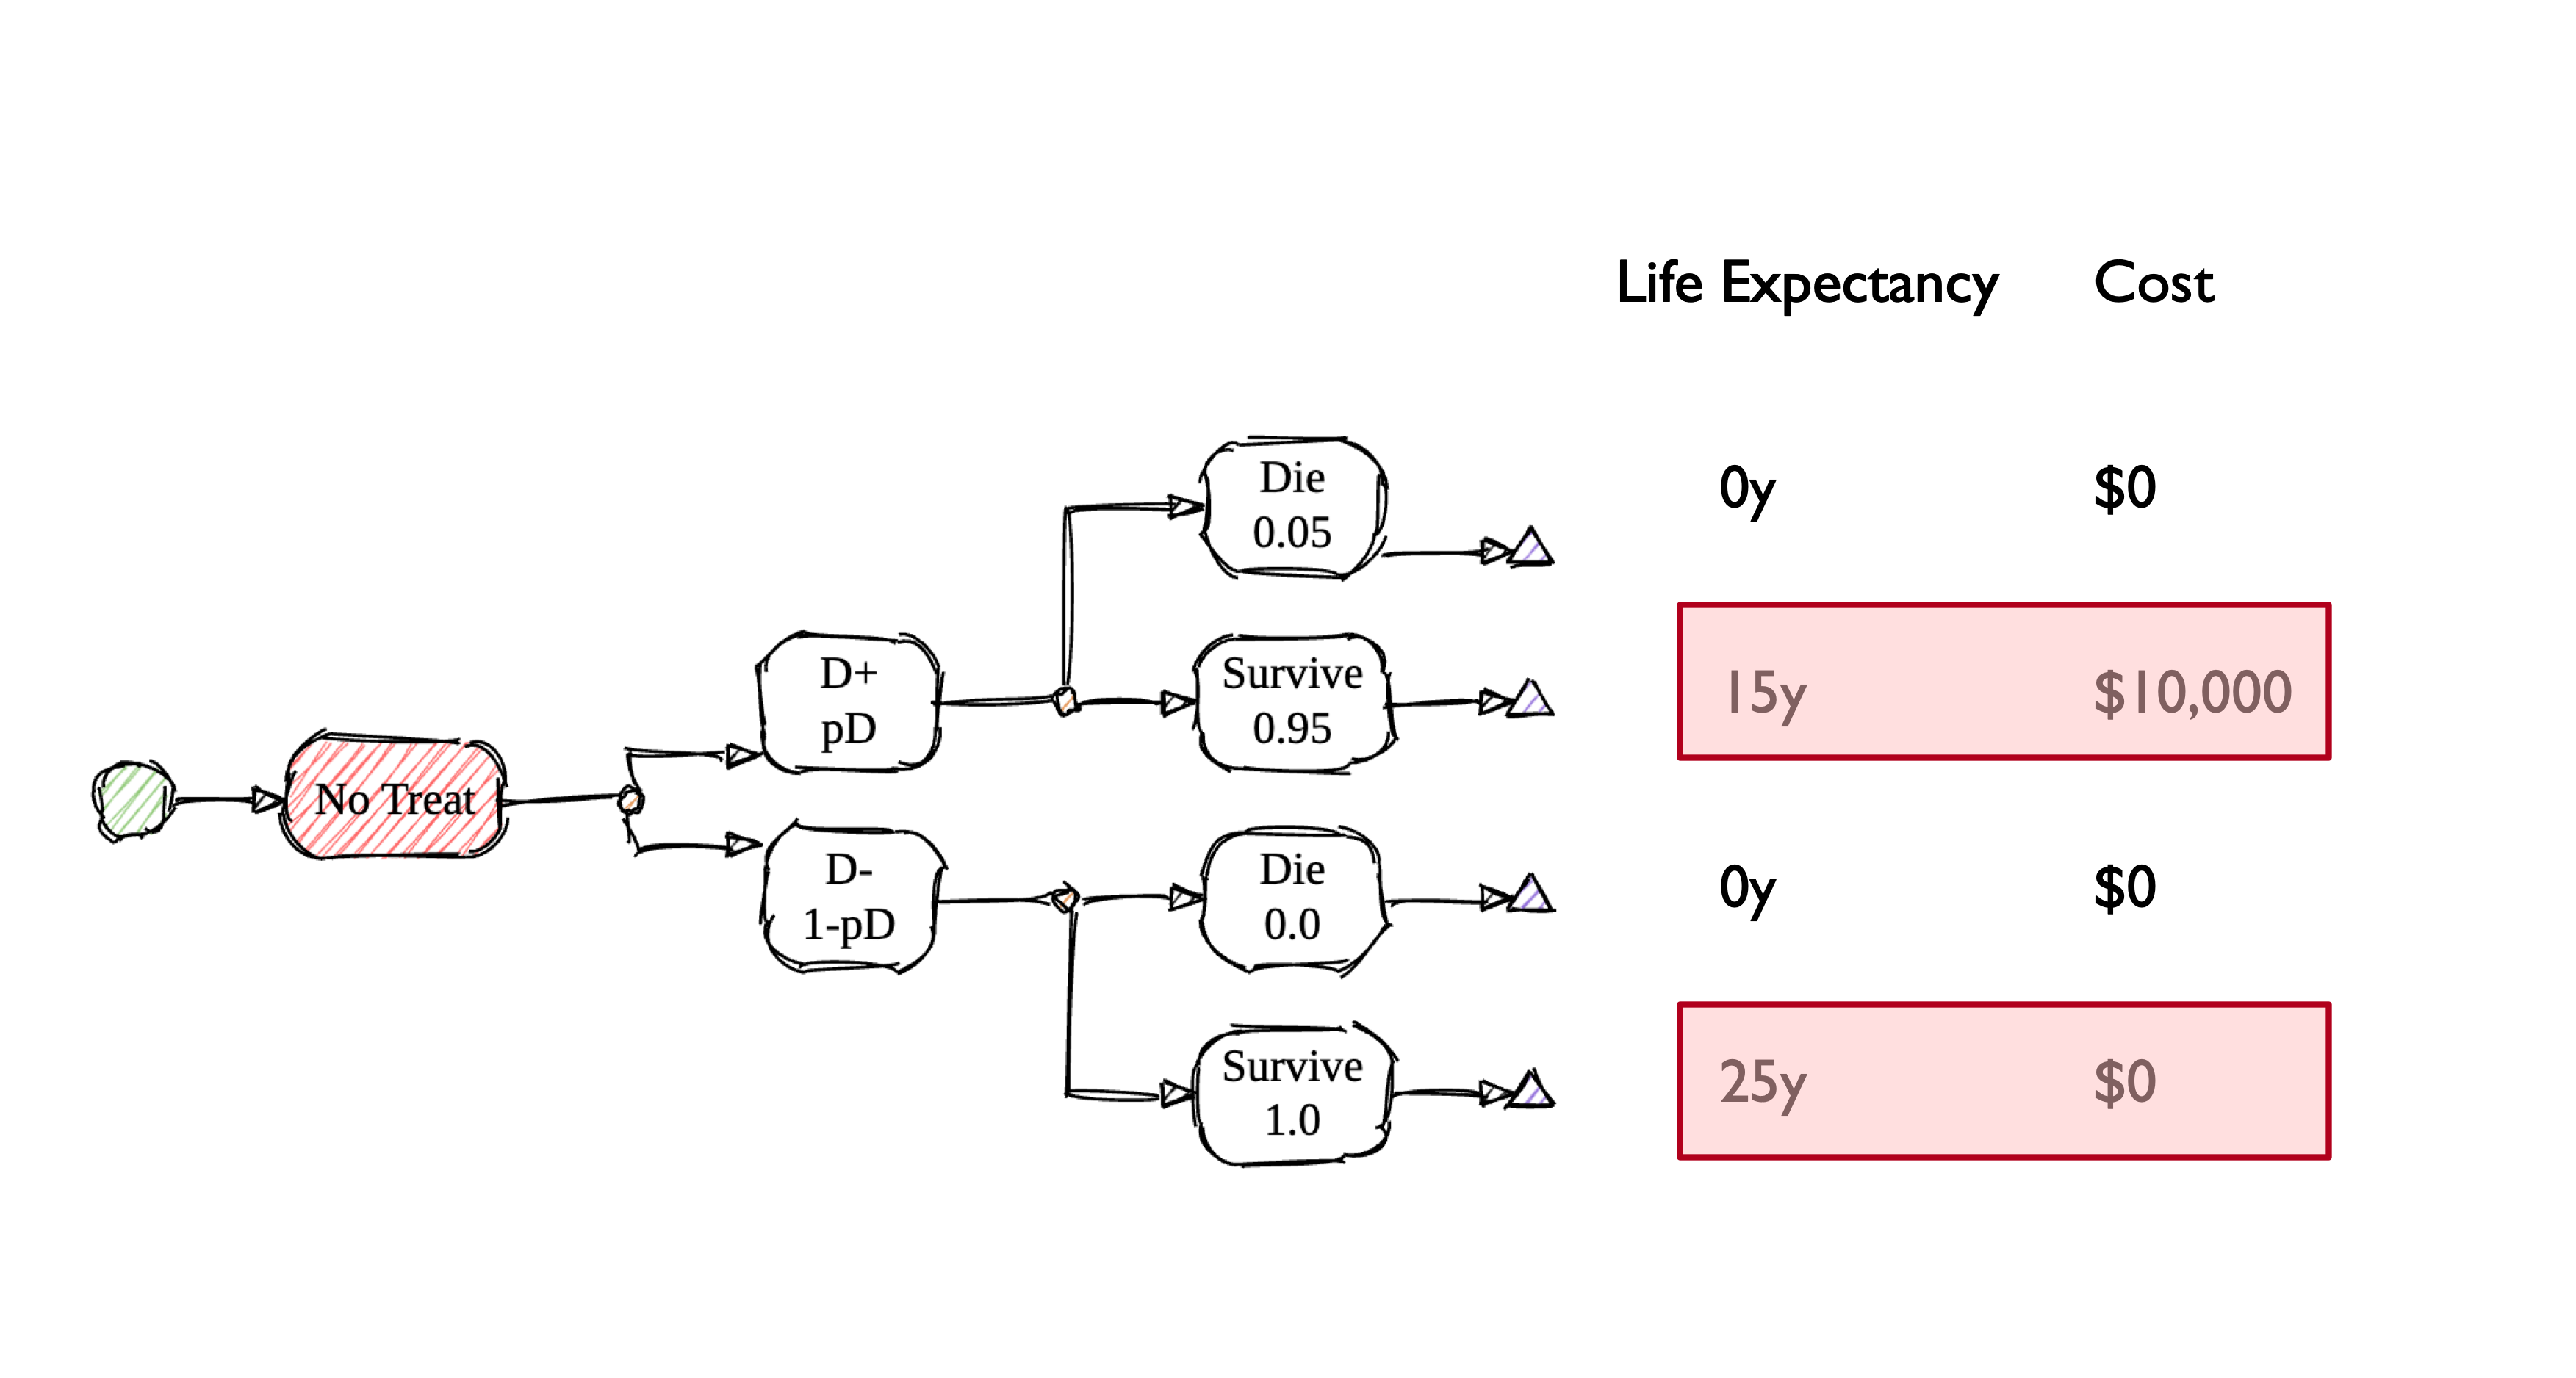
Key Takeaways (For Now)
- Treatment yields higher life expectancy for those with disease, but comes at a cost.
- Treatment yields lower life expectancy for those without the disease, and also comes at a cost.
- Biopsy can help balance these two outcomes by better targeting treatment, but also comes with risks and costs.
- Incremental CEA provides a transparent framework for quantifying and weighing these considerations.
:::
Shopping Spree Problem
1
Remove Dominated Strategies
Rule out programs that cost $ but have negative health effects. Dominated by alternative of “no program”
Shopping Spree Problem
2
Select programs that are cost-saving & offer benefit
Net savings can also be added to budget
Cost-saving compared to alternative of no program
Shopping Spree Problem
3
Rank other programs
- Rank other programs in ascending order by their cost-effectiveness ratio (lowest to highest)
- Programs are selected from the least to the most expensive until the budget is exhausted
- Final selection depends on the budget constraint
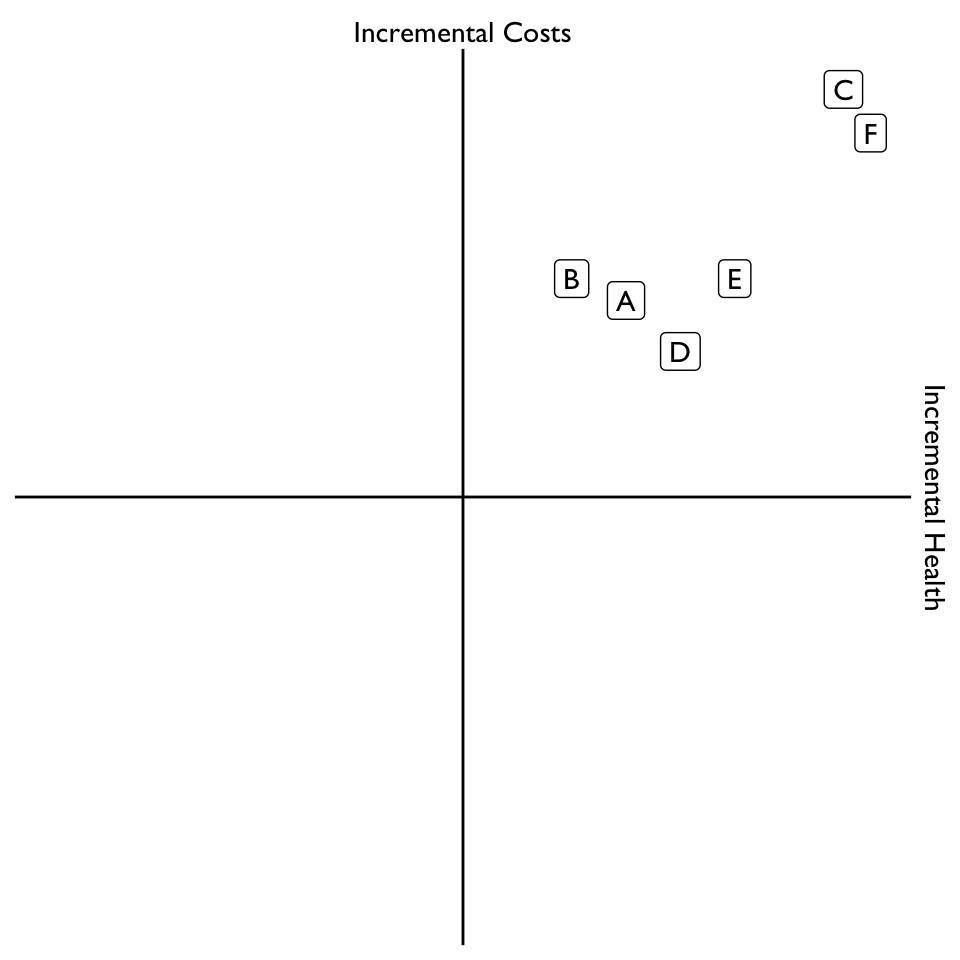
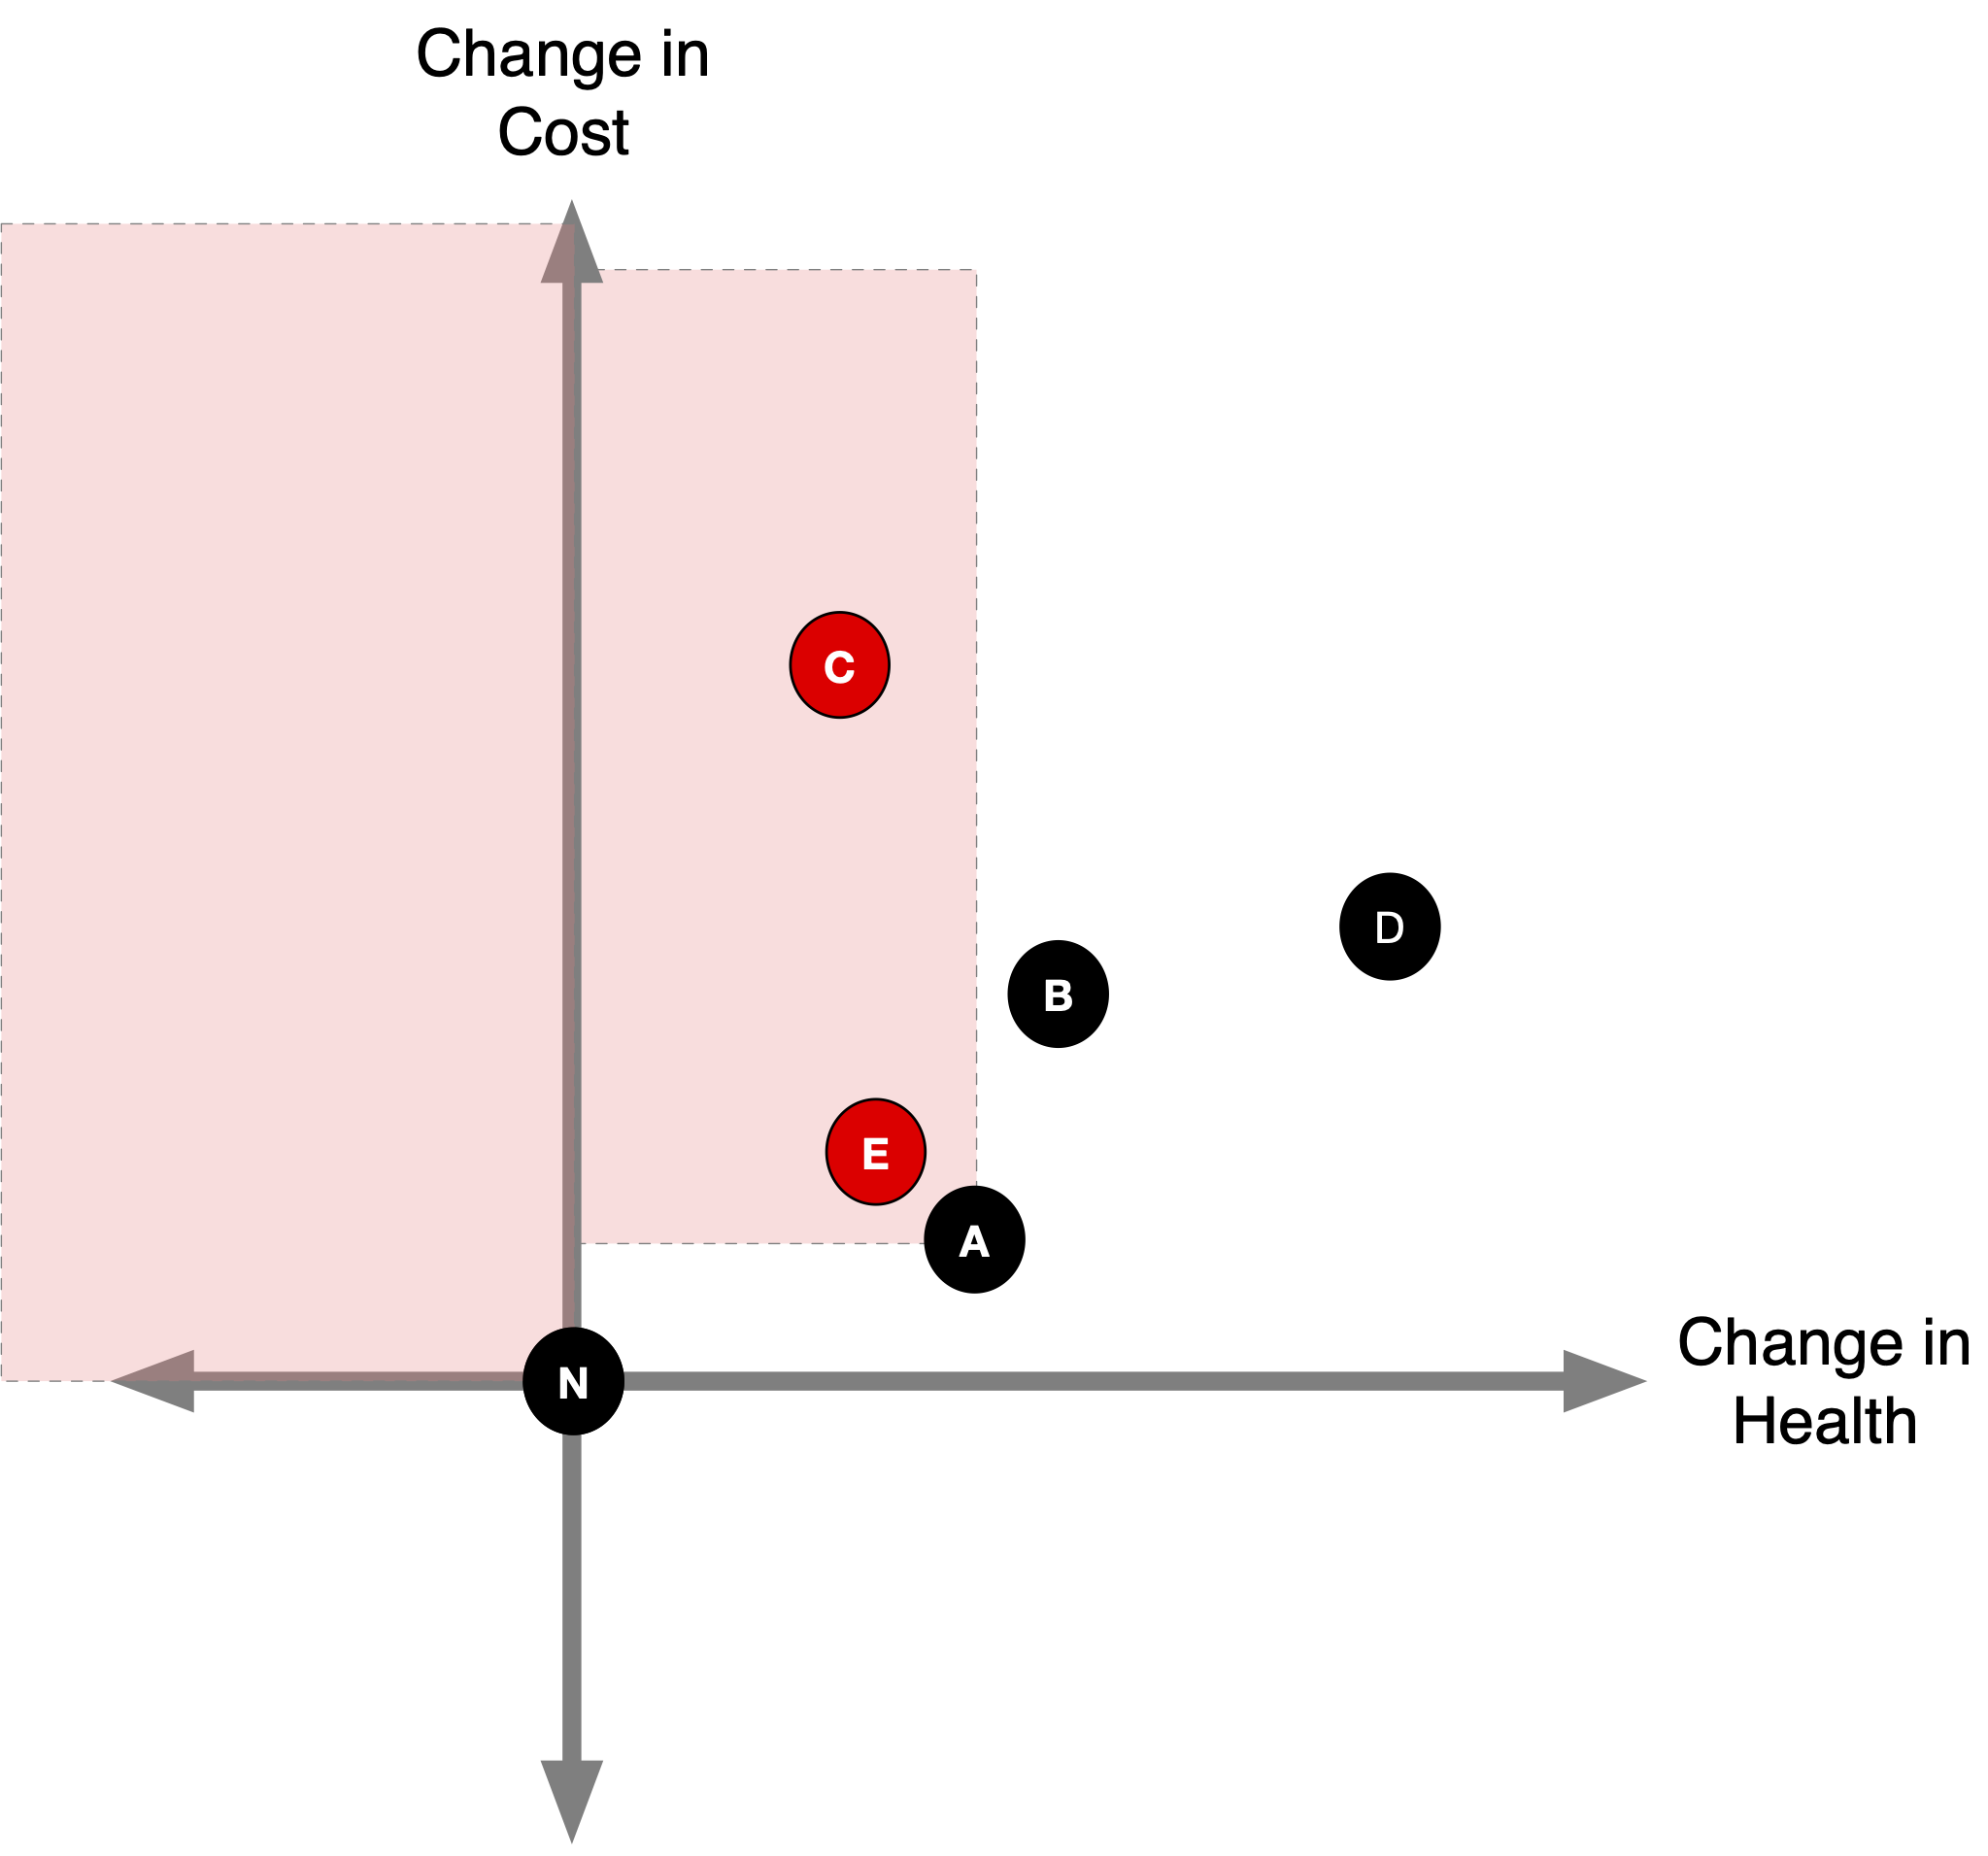
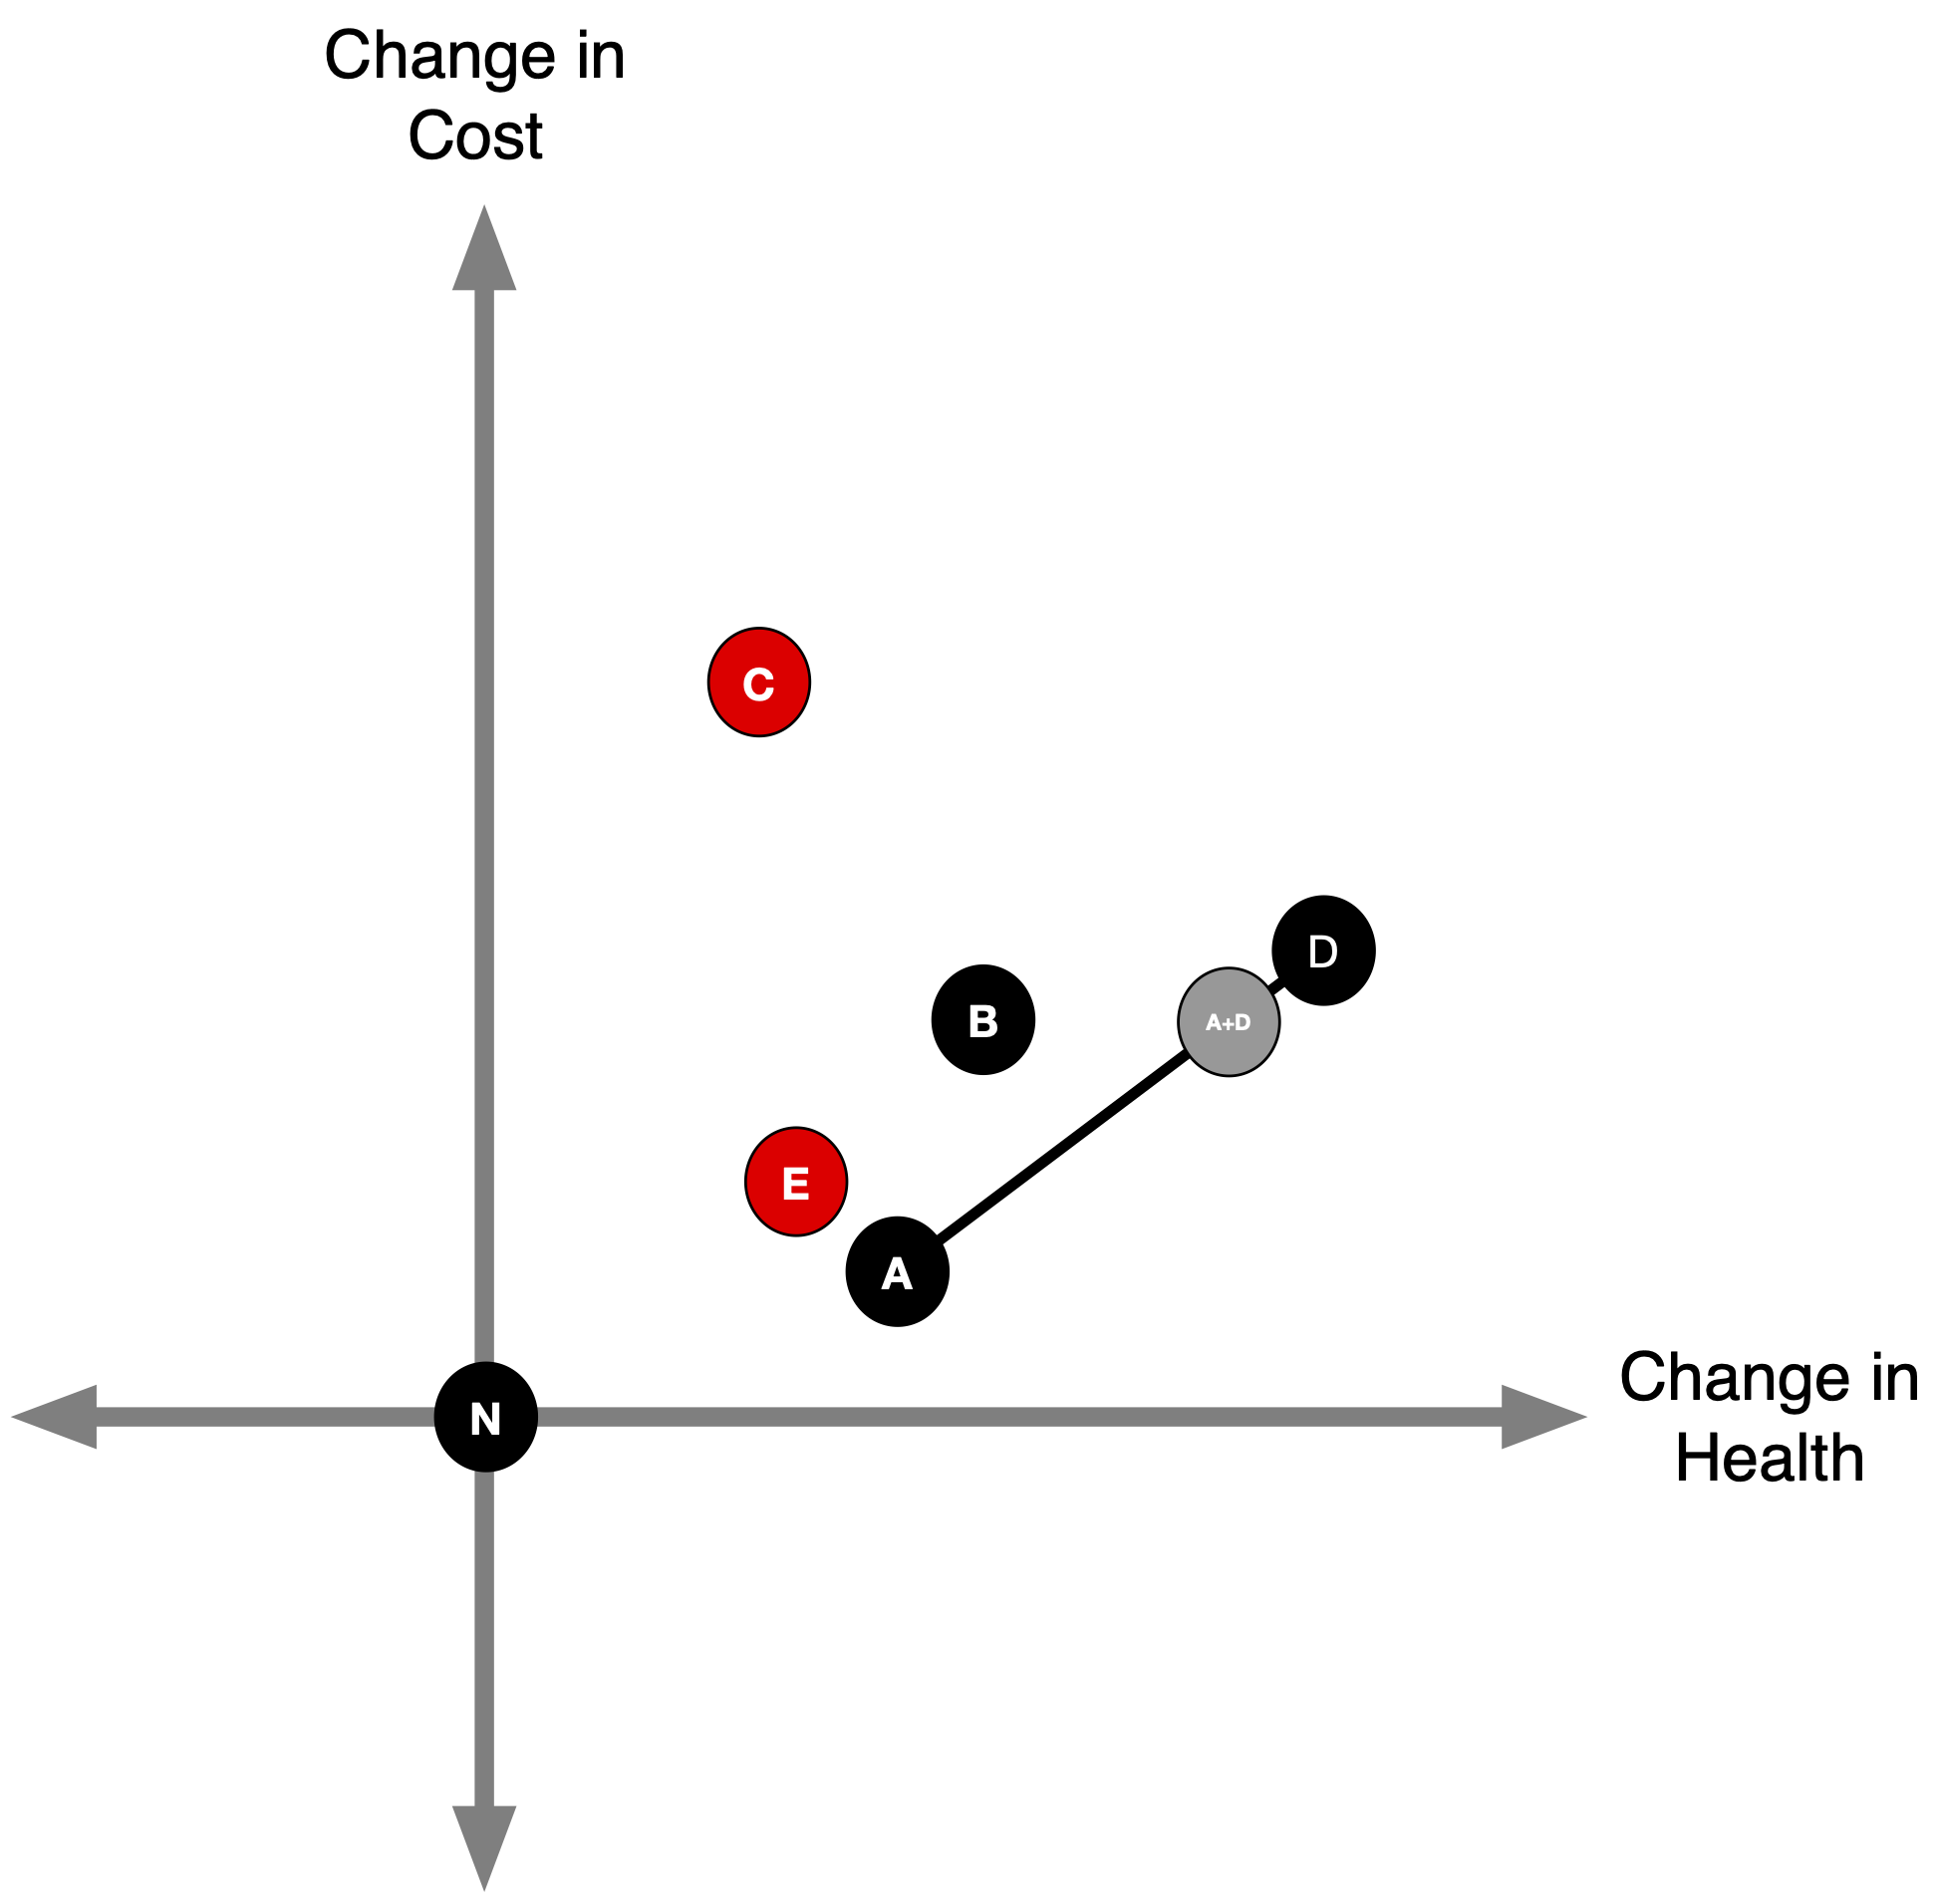
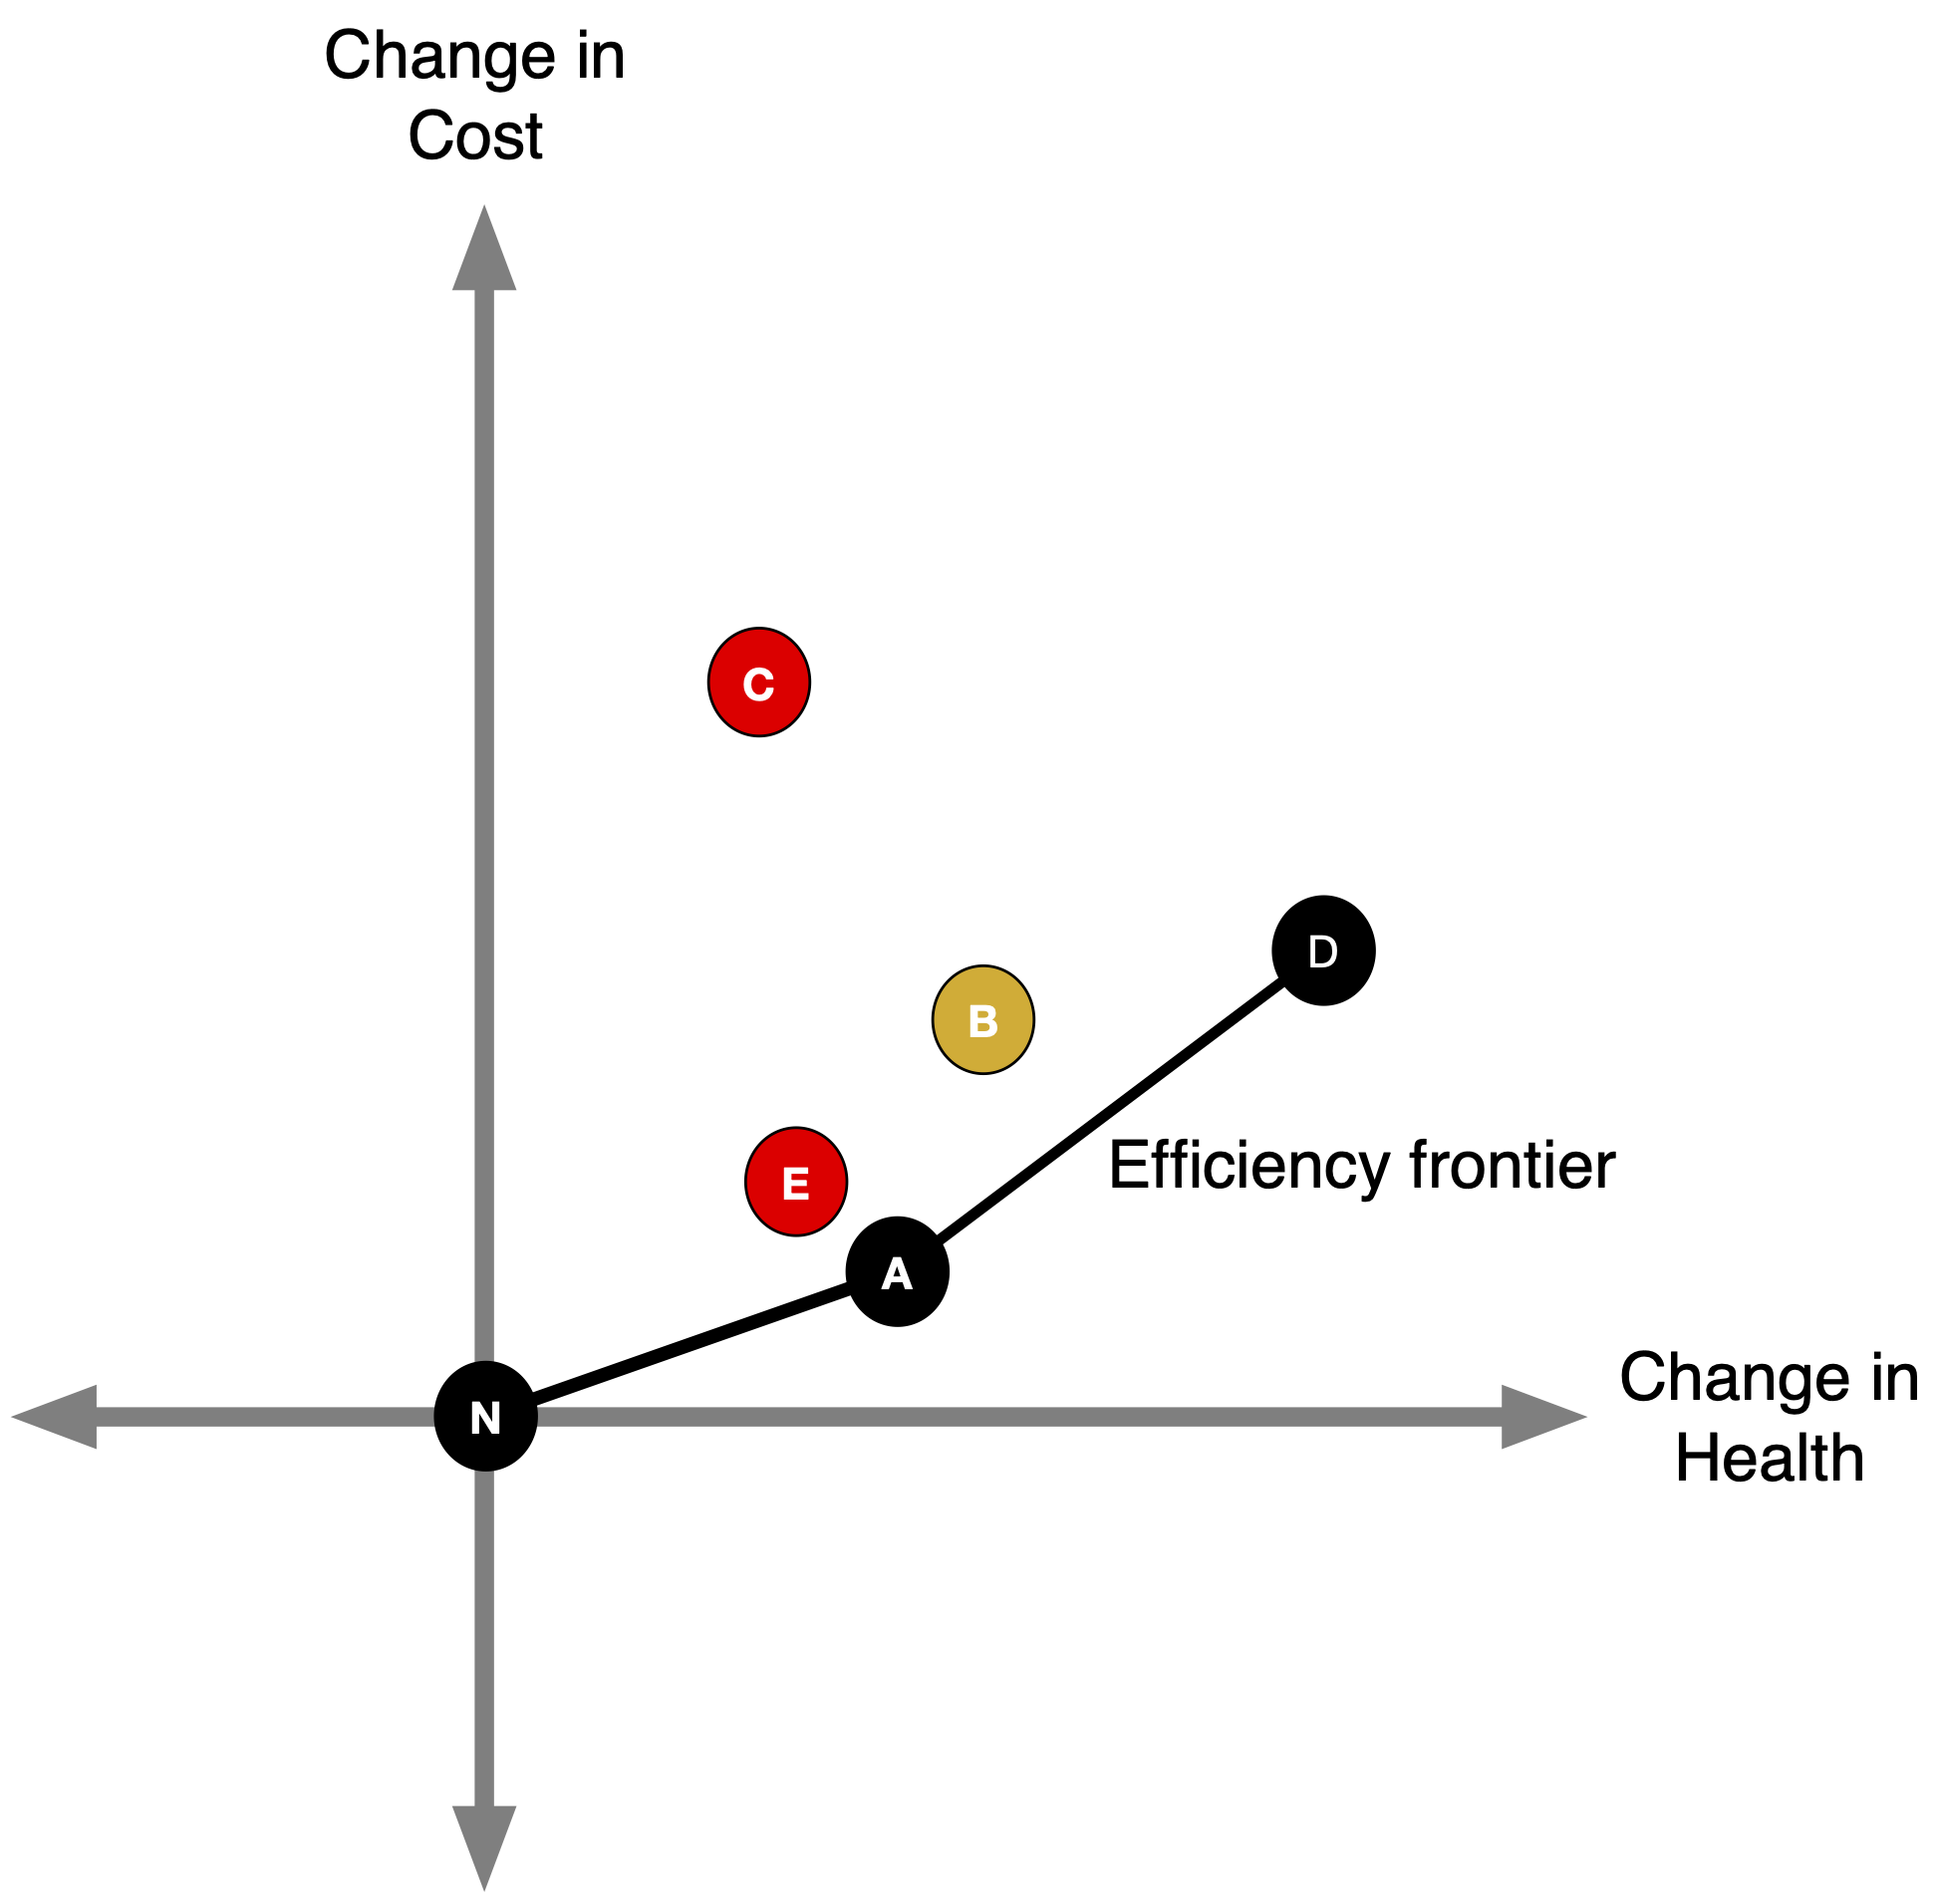
(1) Calculate incremental costs and effects
- Often, a strategy capturing current practice (‘status-quo’, ‘do nothing’, ‘natural history’) is defined.
- Costs and effects are then calculated for each strategy relative to the status-quo.
- Plot the difference in costs and effects with health effects on x-axis and cost effects on y-axis.
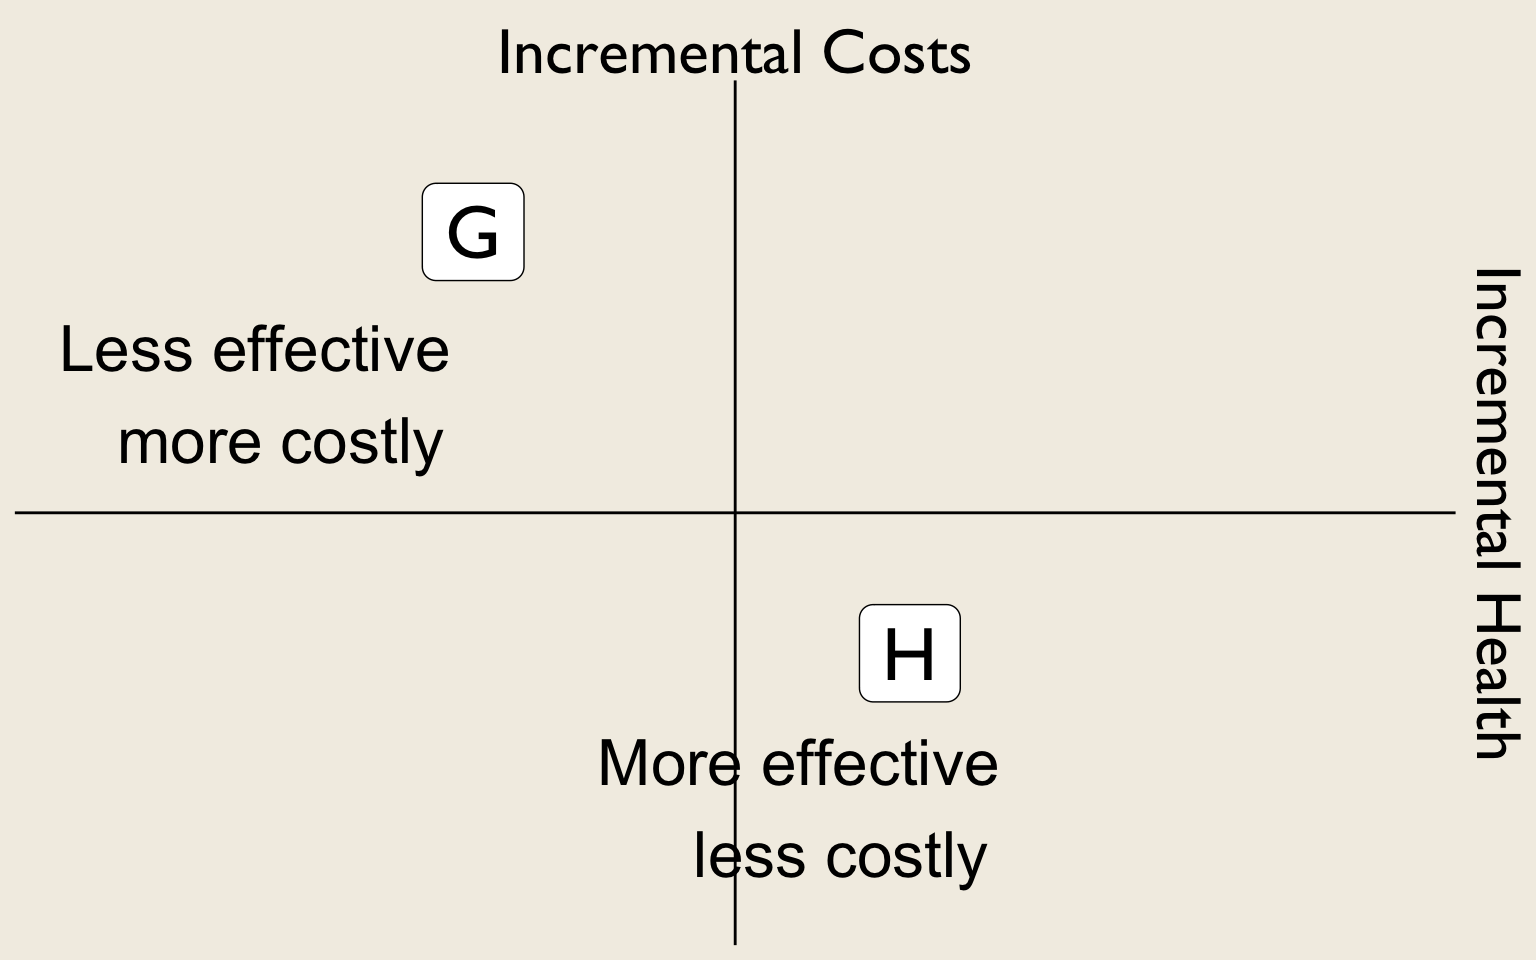
(2a) Identify Dominated Strategies
- We can rule out any strategies that result in less health at higher cost.
(2b) Identify Dominated Strategies
- We can also rule out strategies where some other competing strategy results in more (or equal) health at lower (or equal) cost.
- This is known as “strong” dominance.
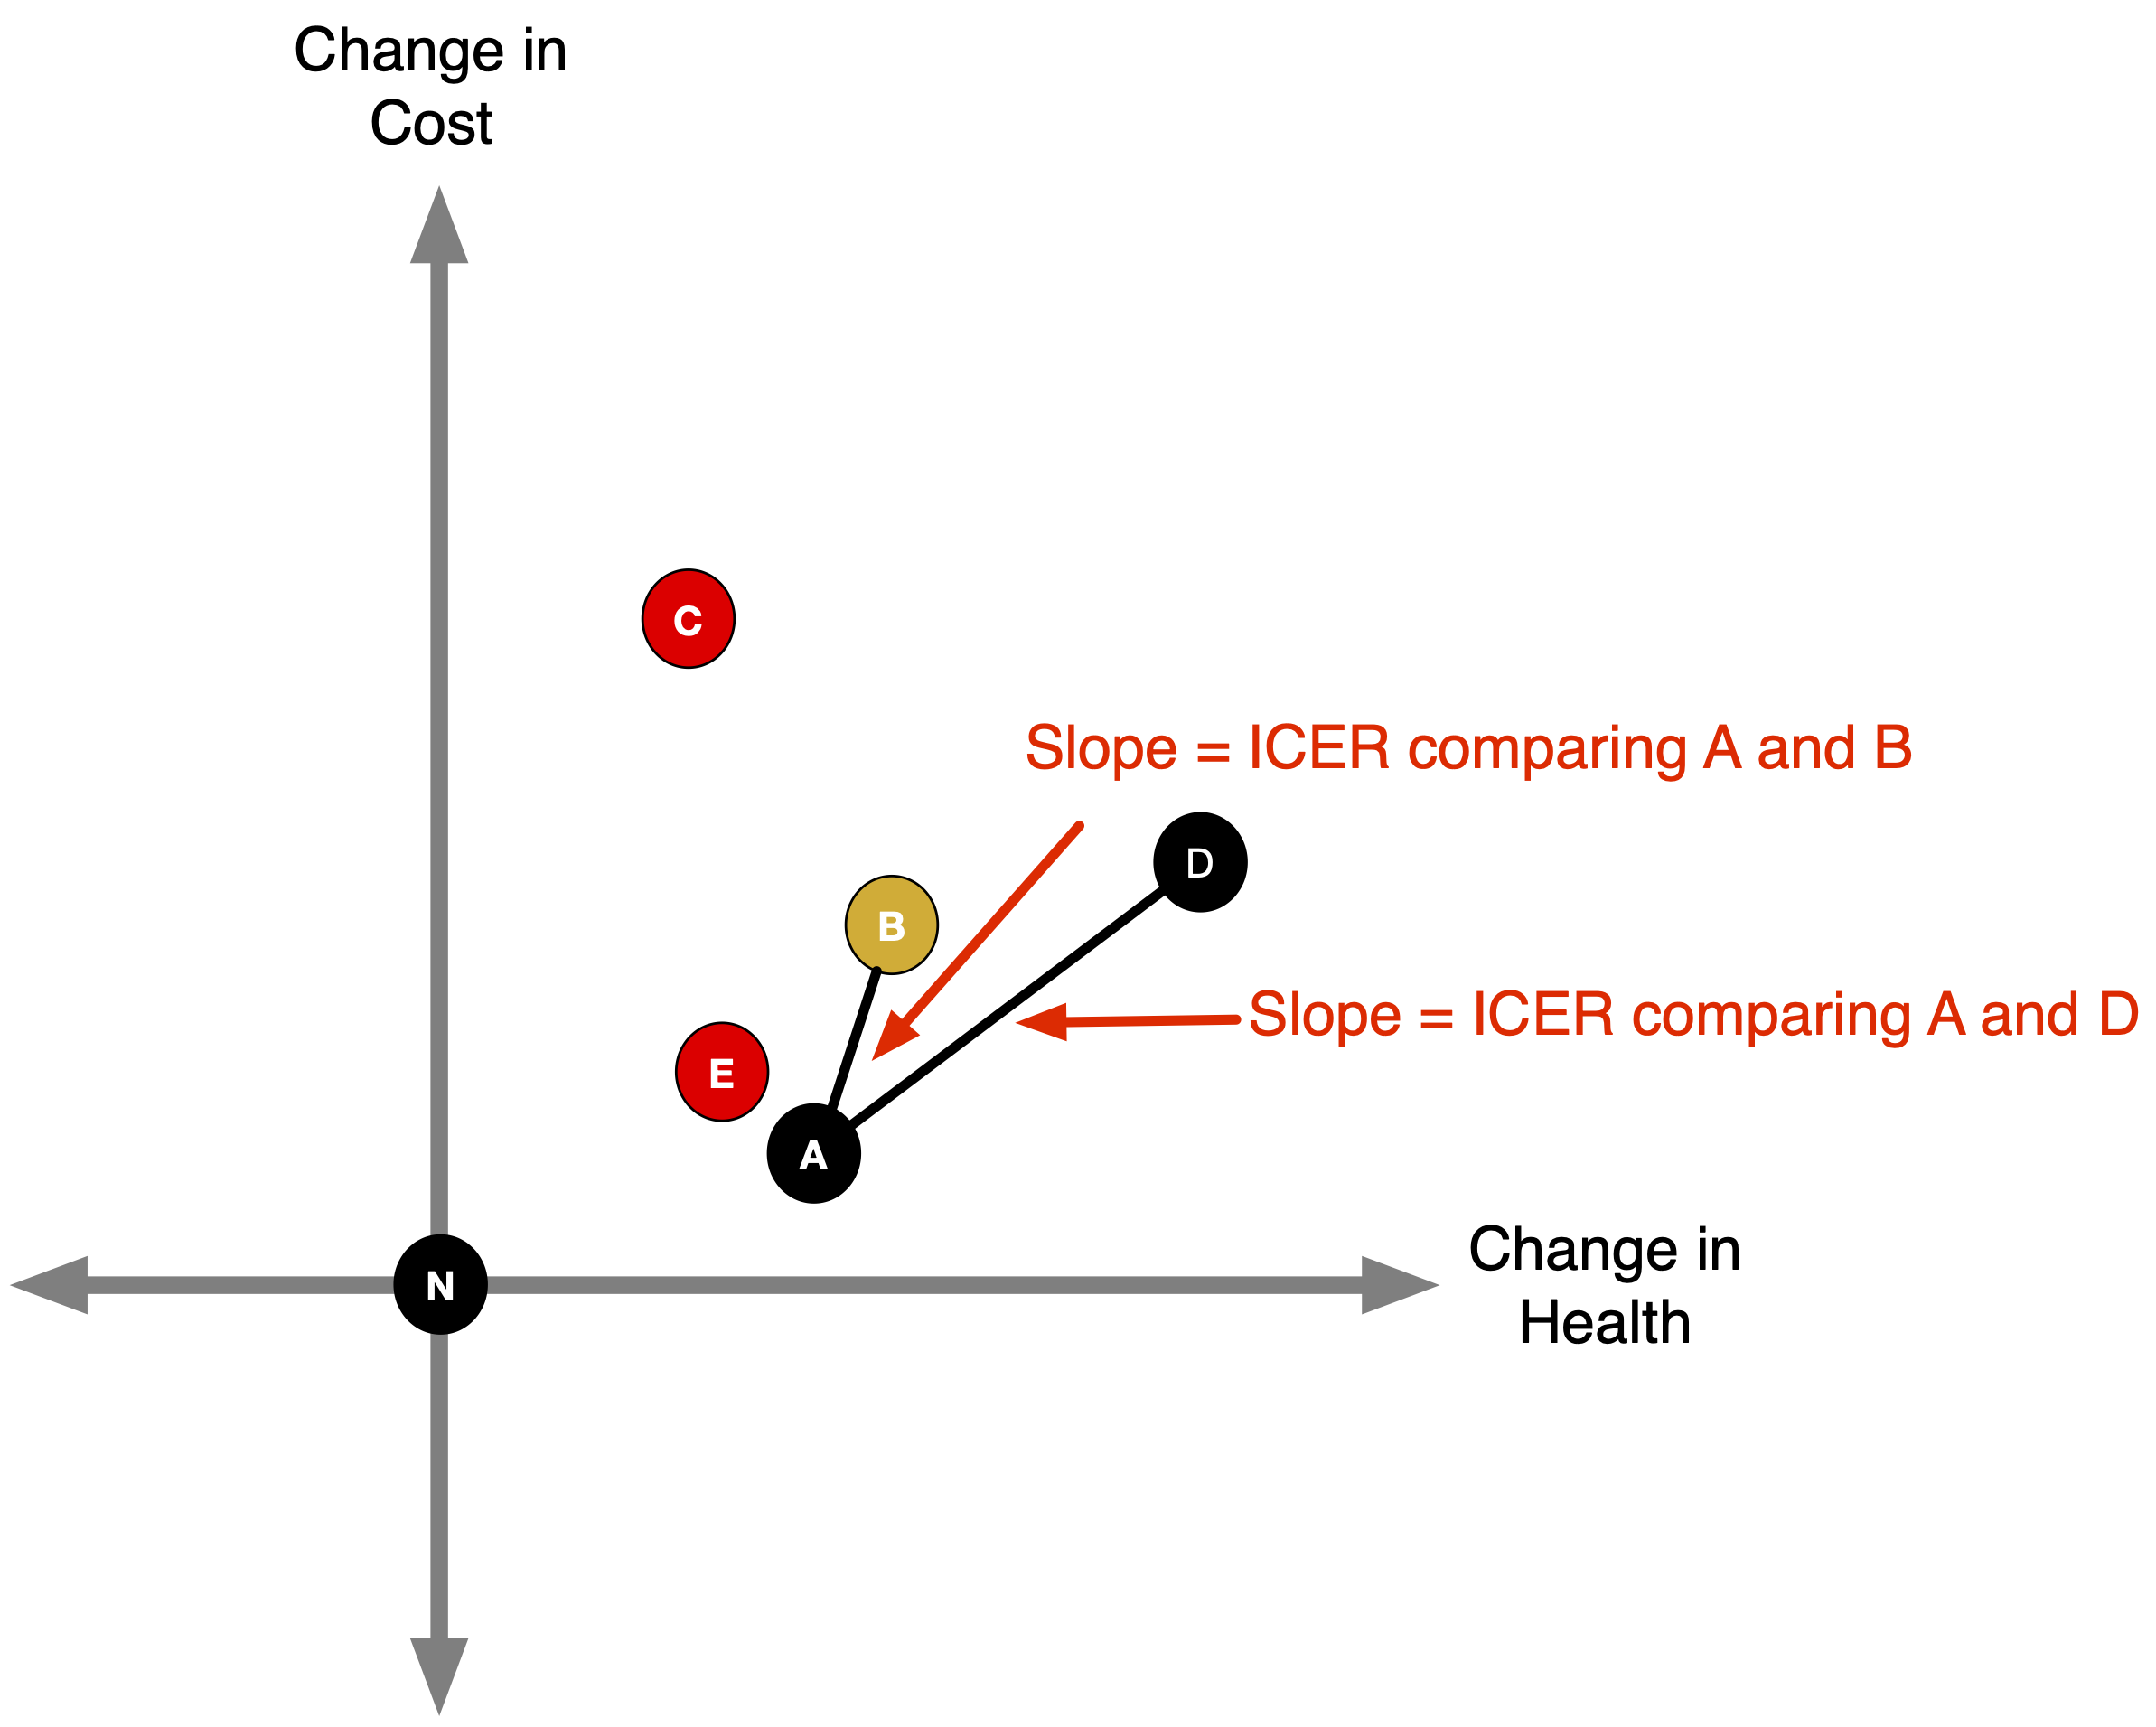
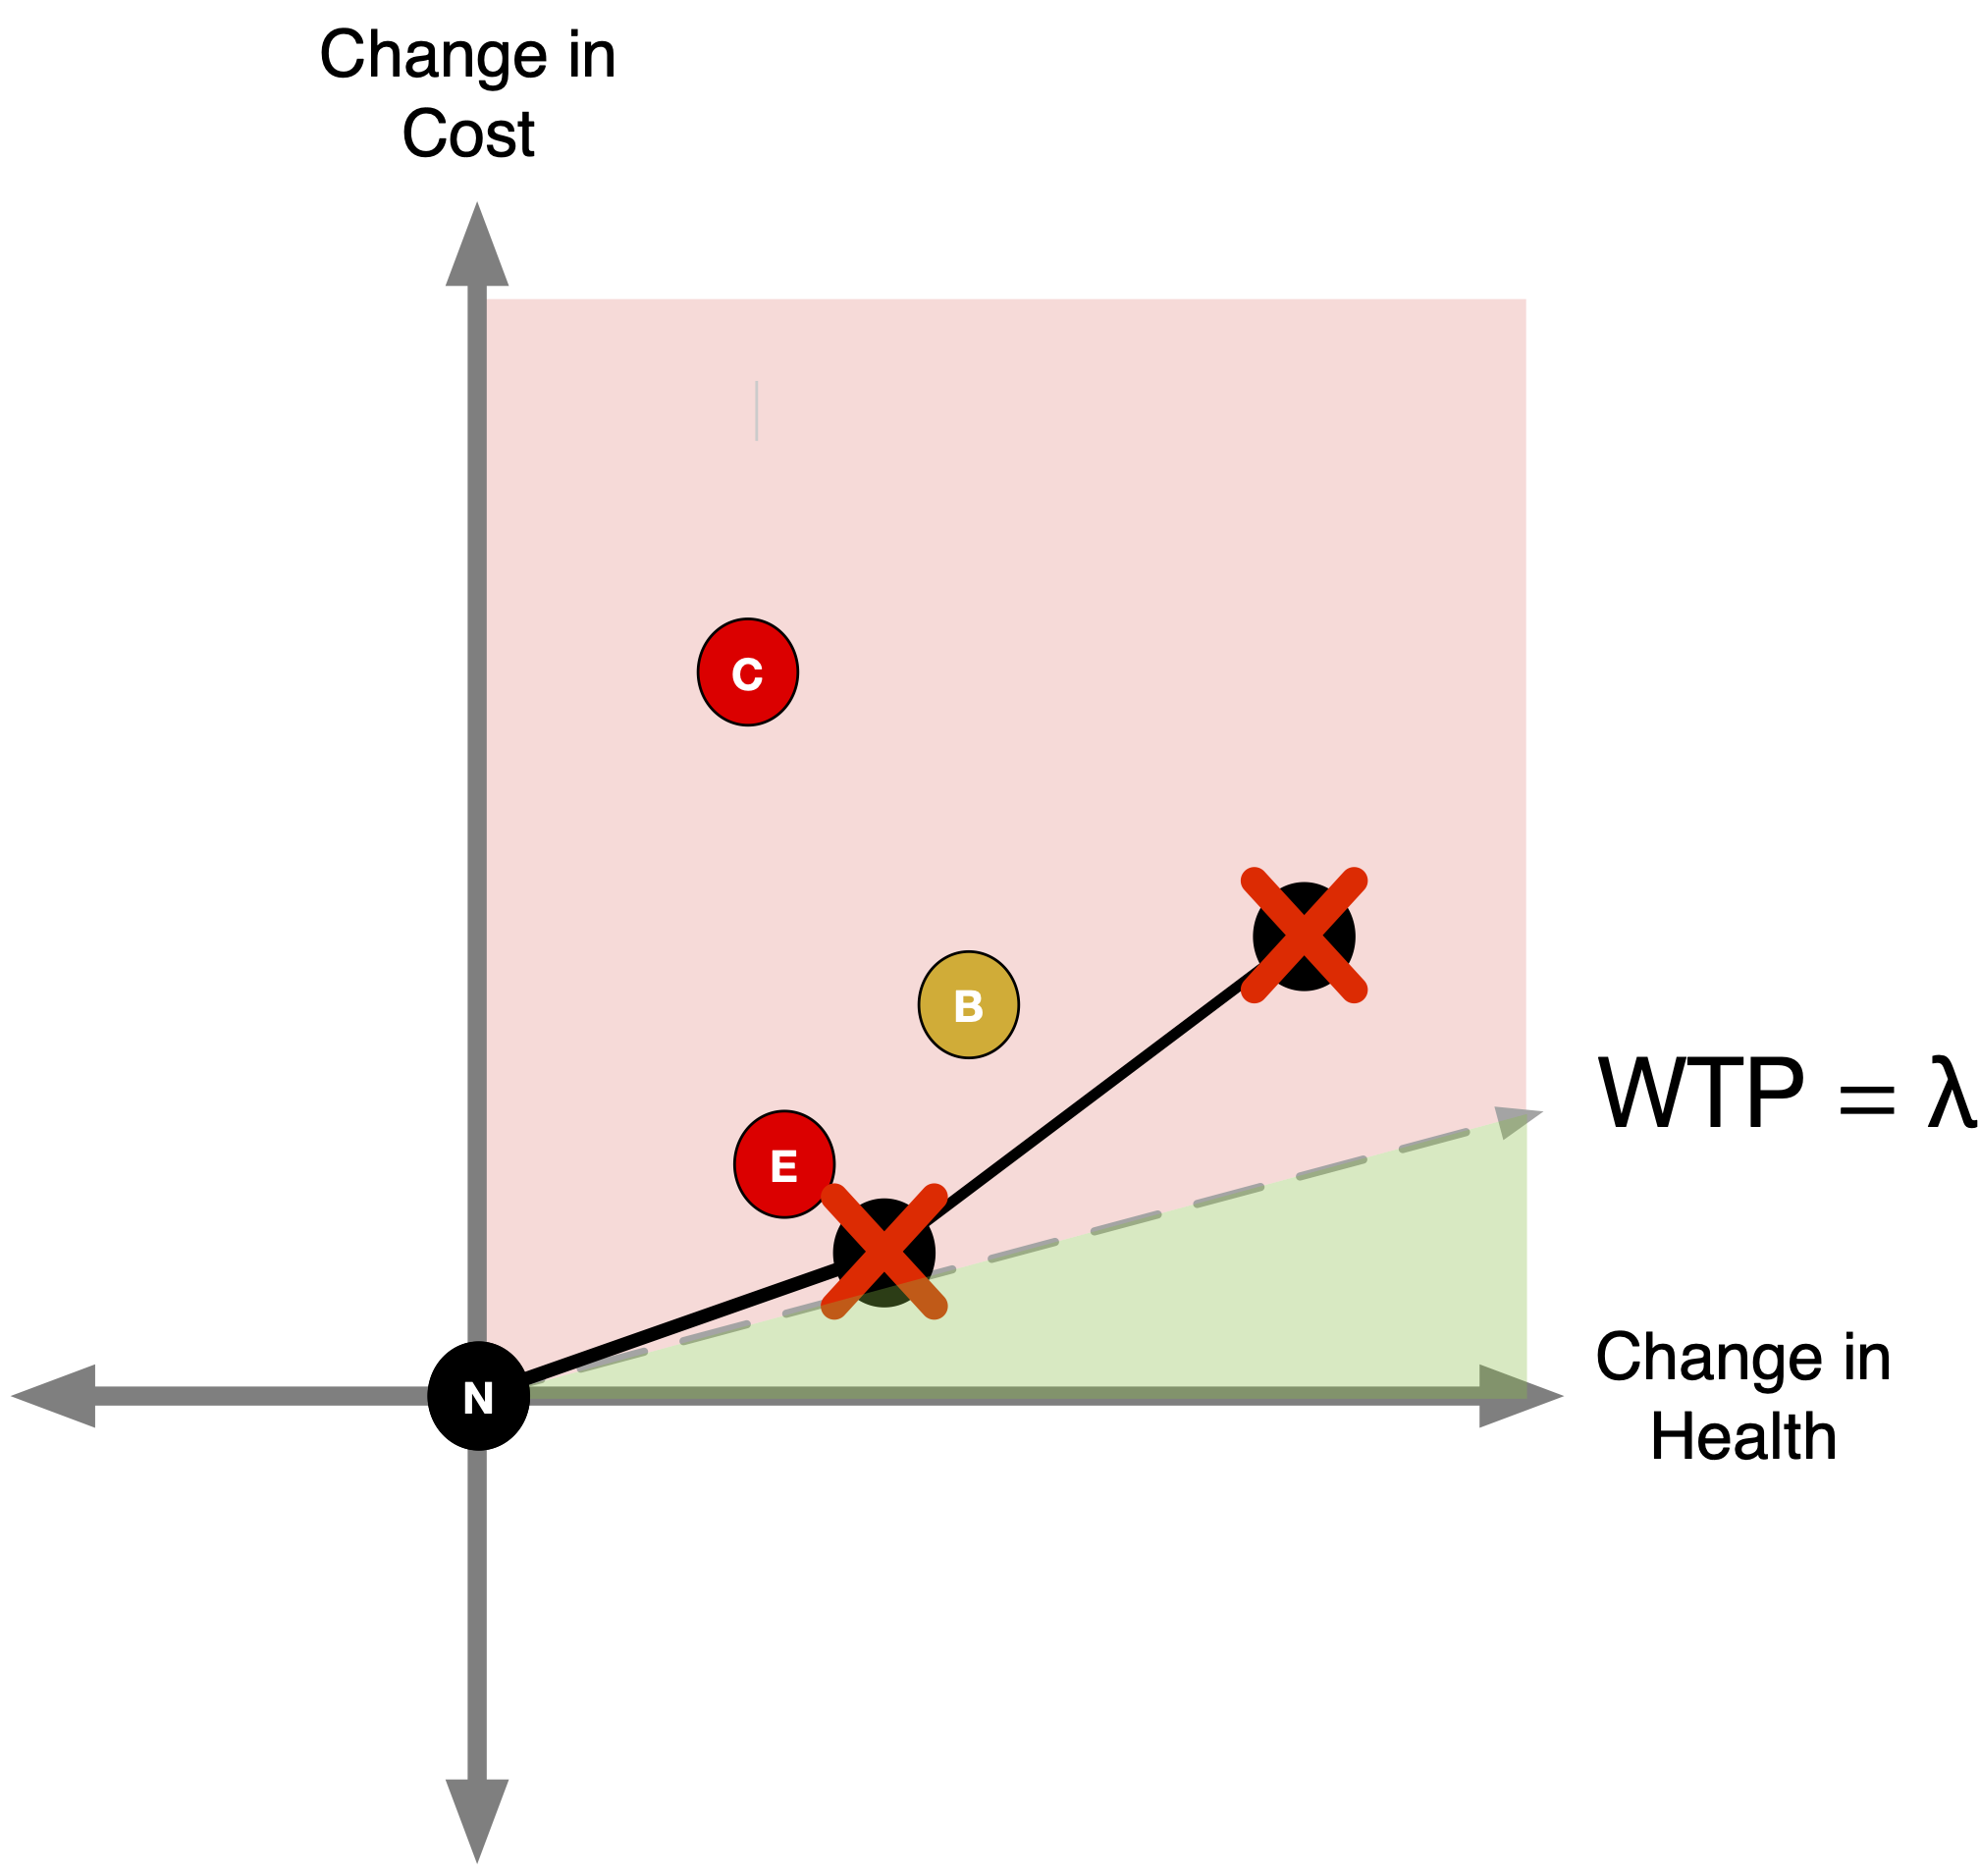
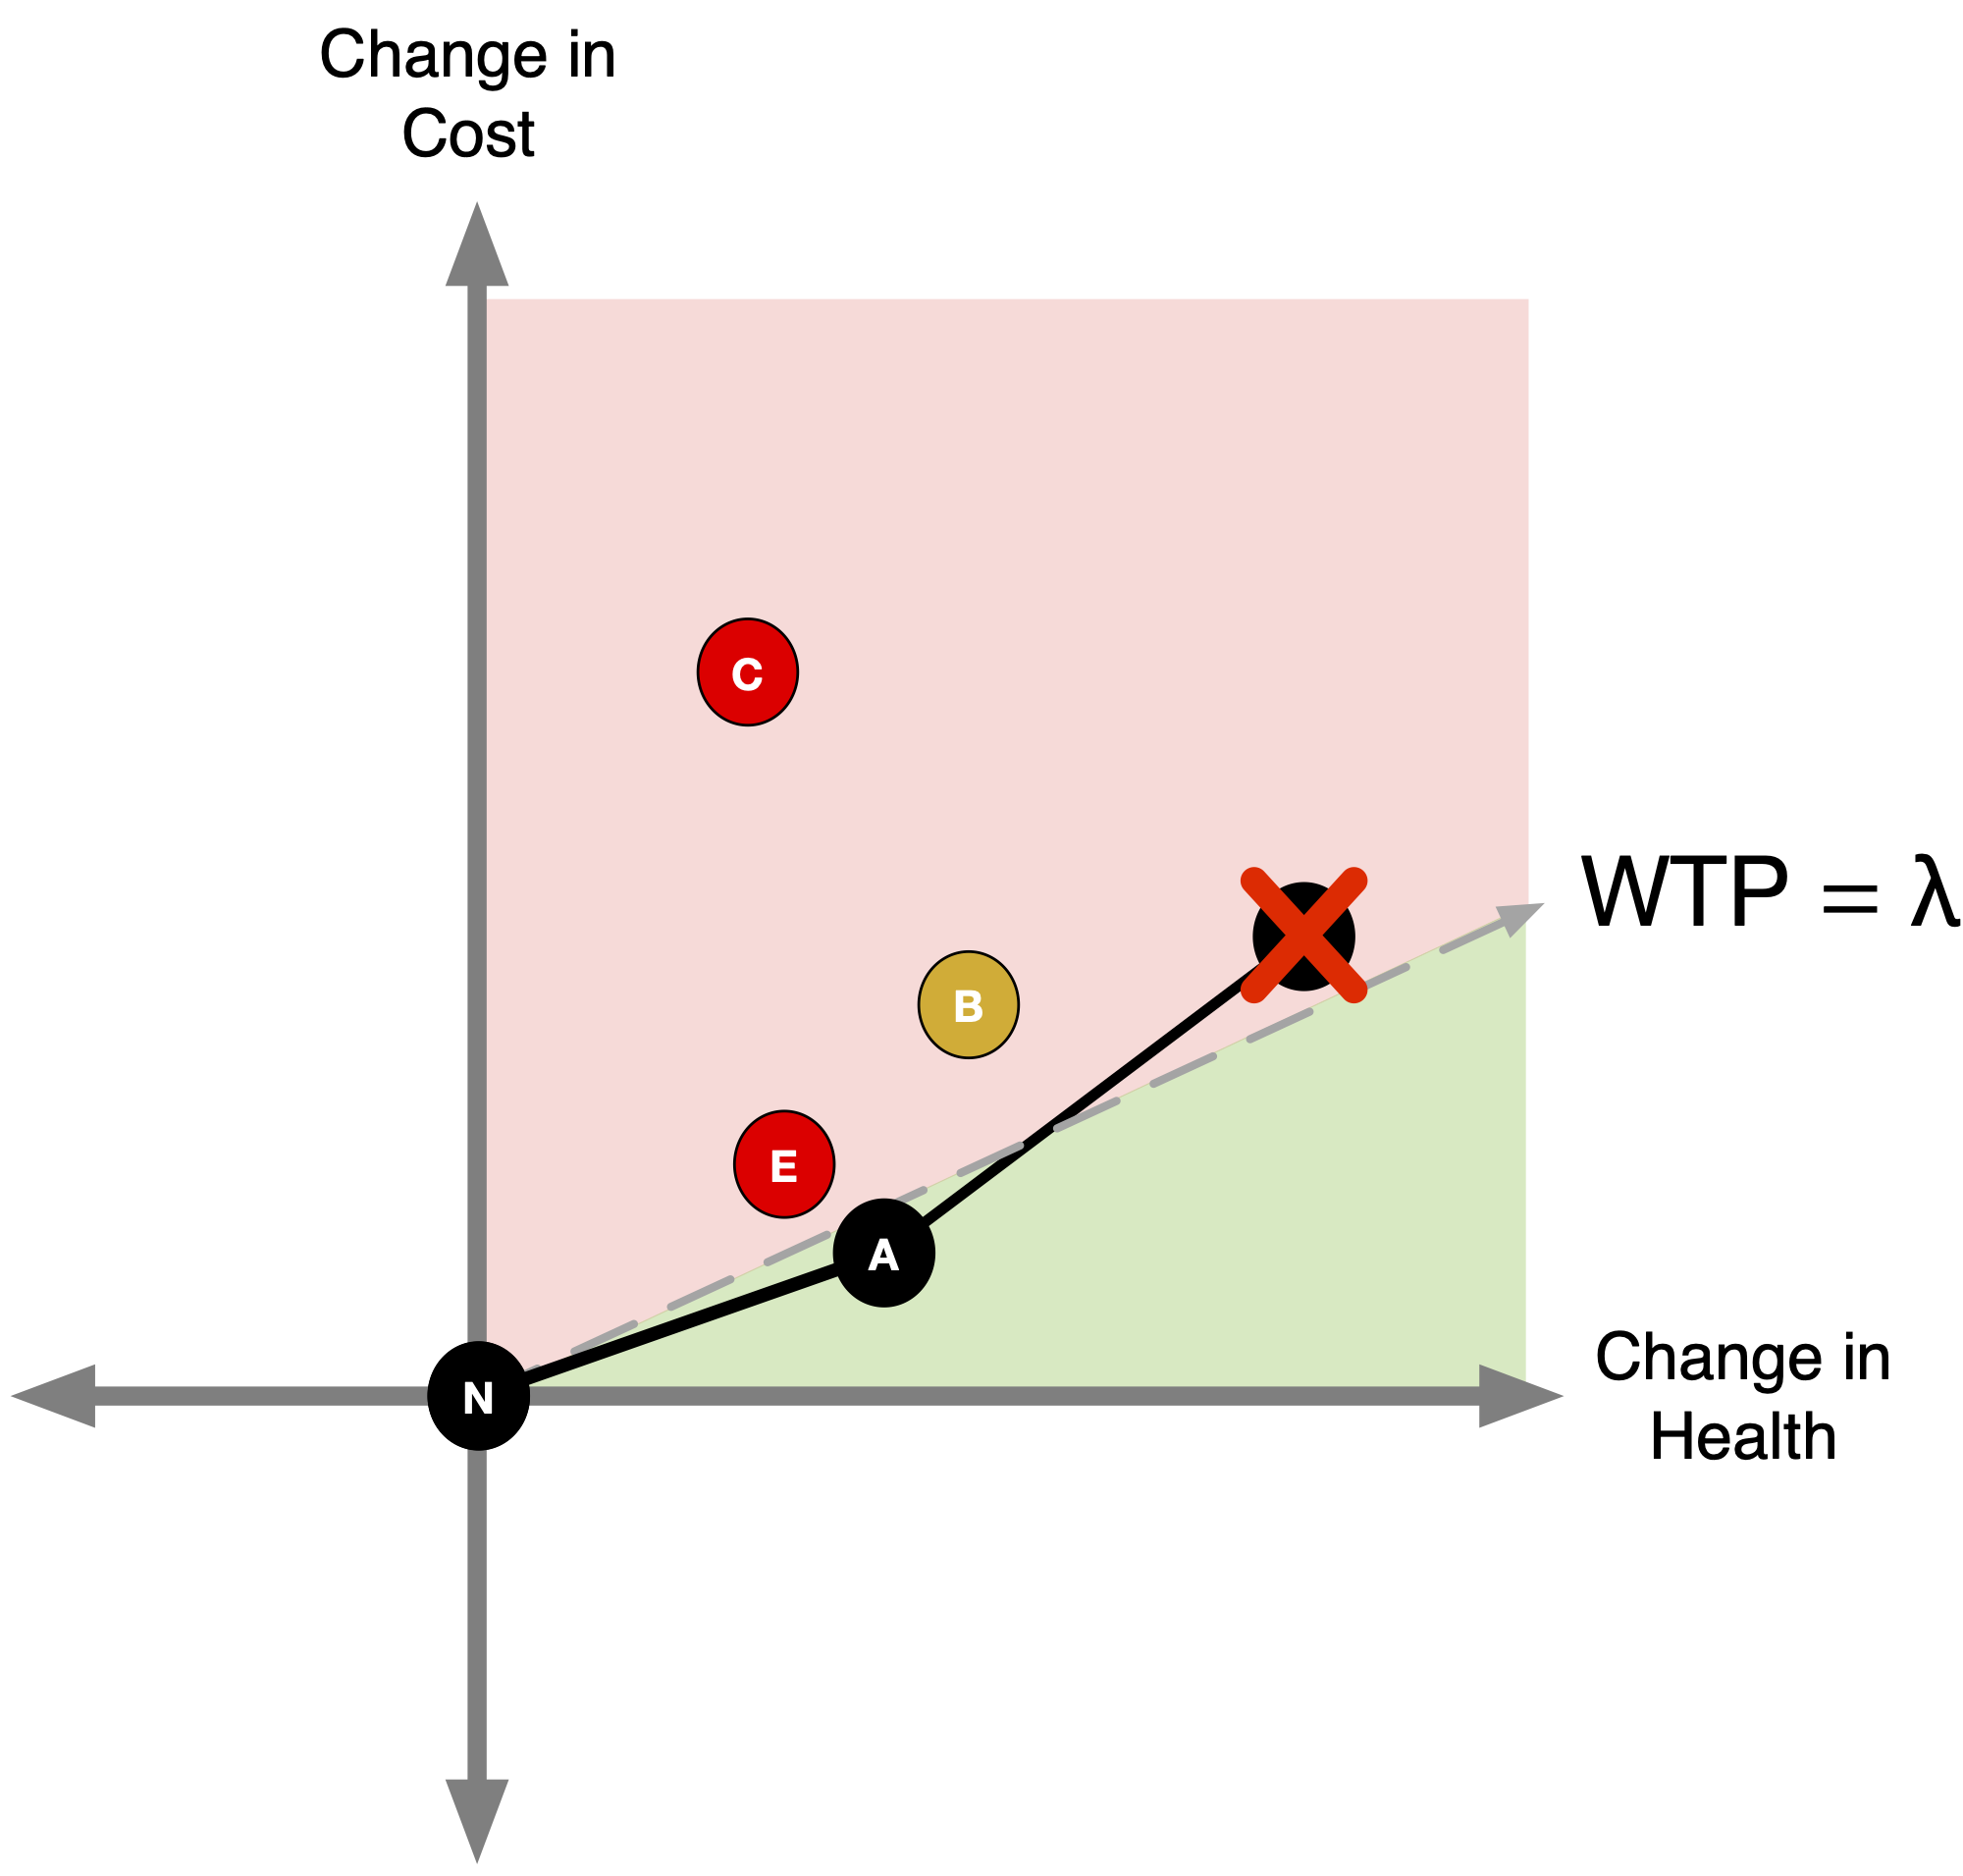
(2b) Identify Dominated Strategies
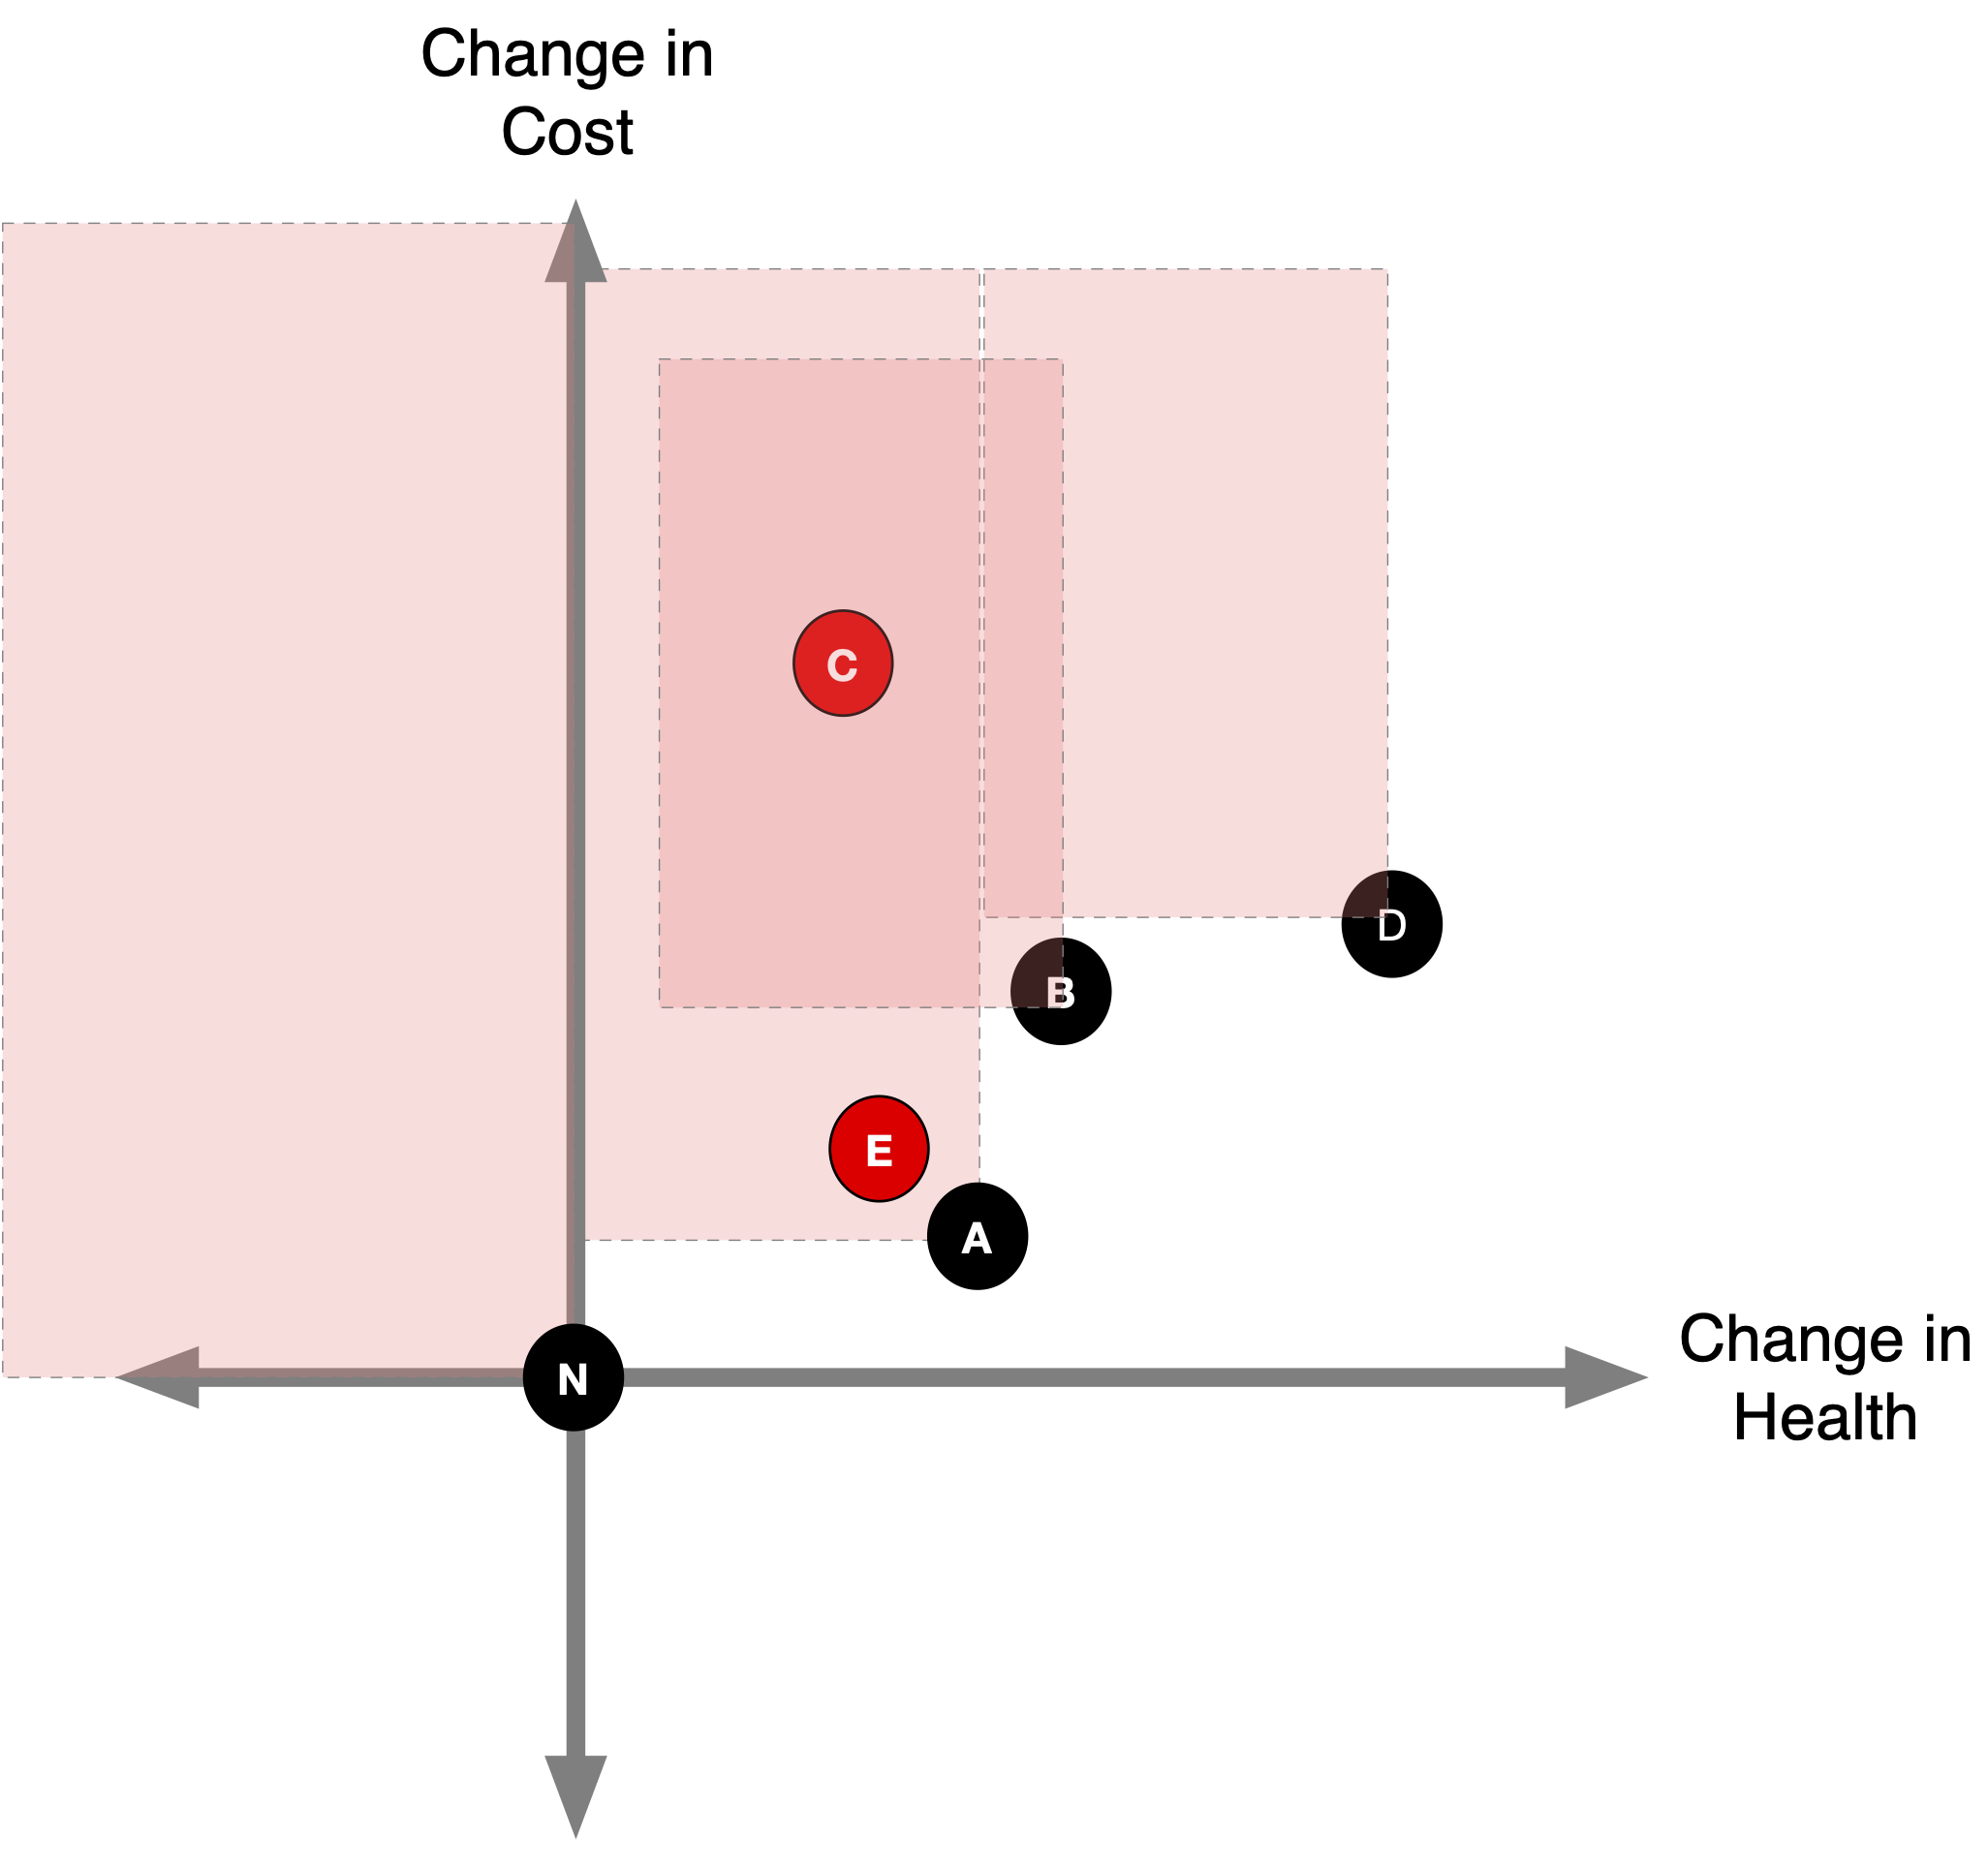
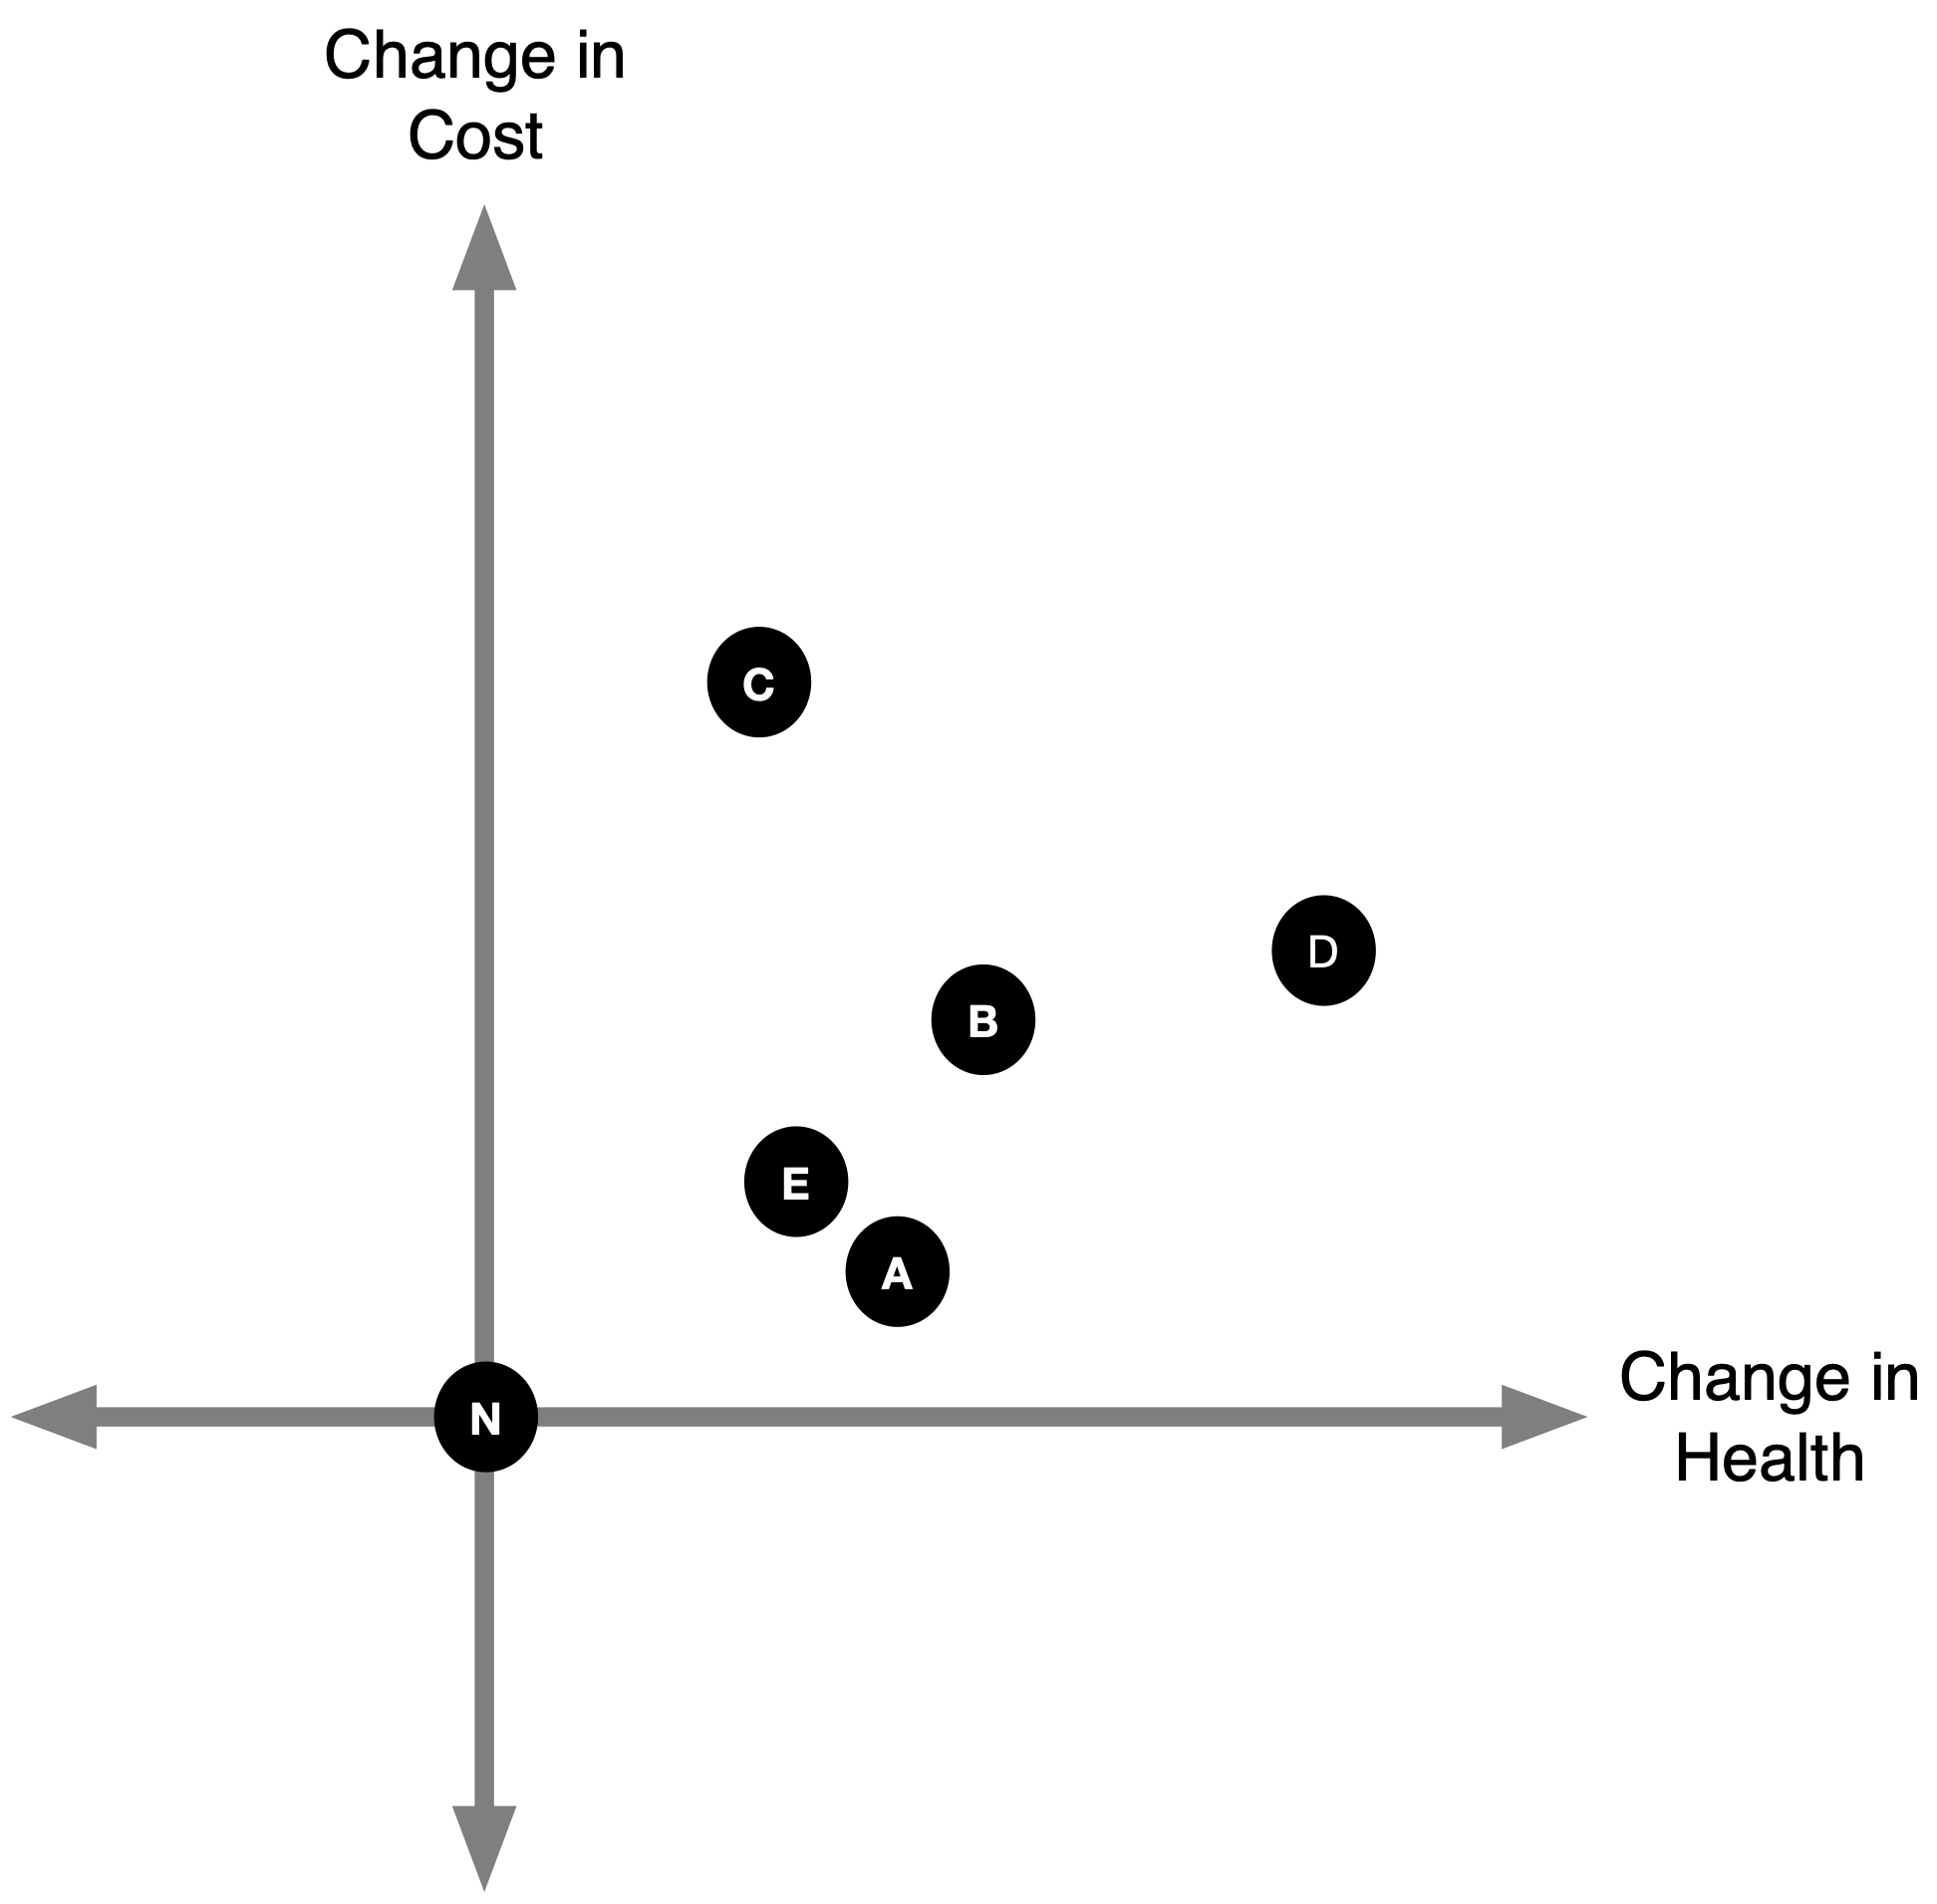
What about strategy B?
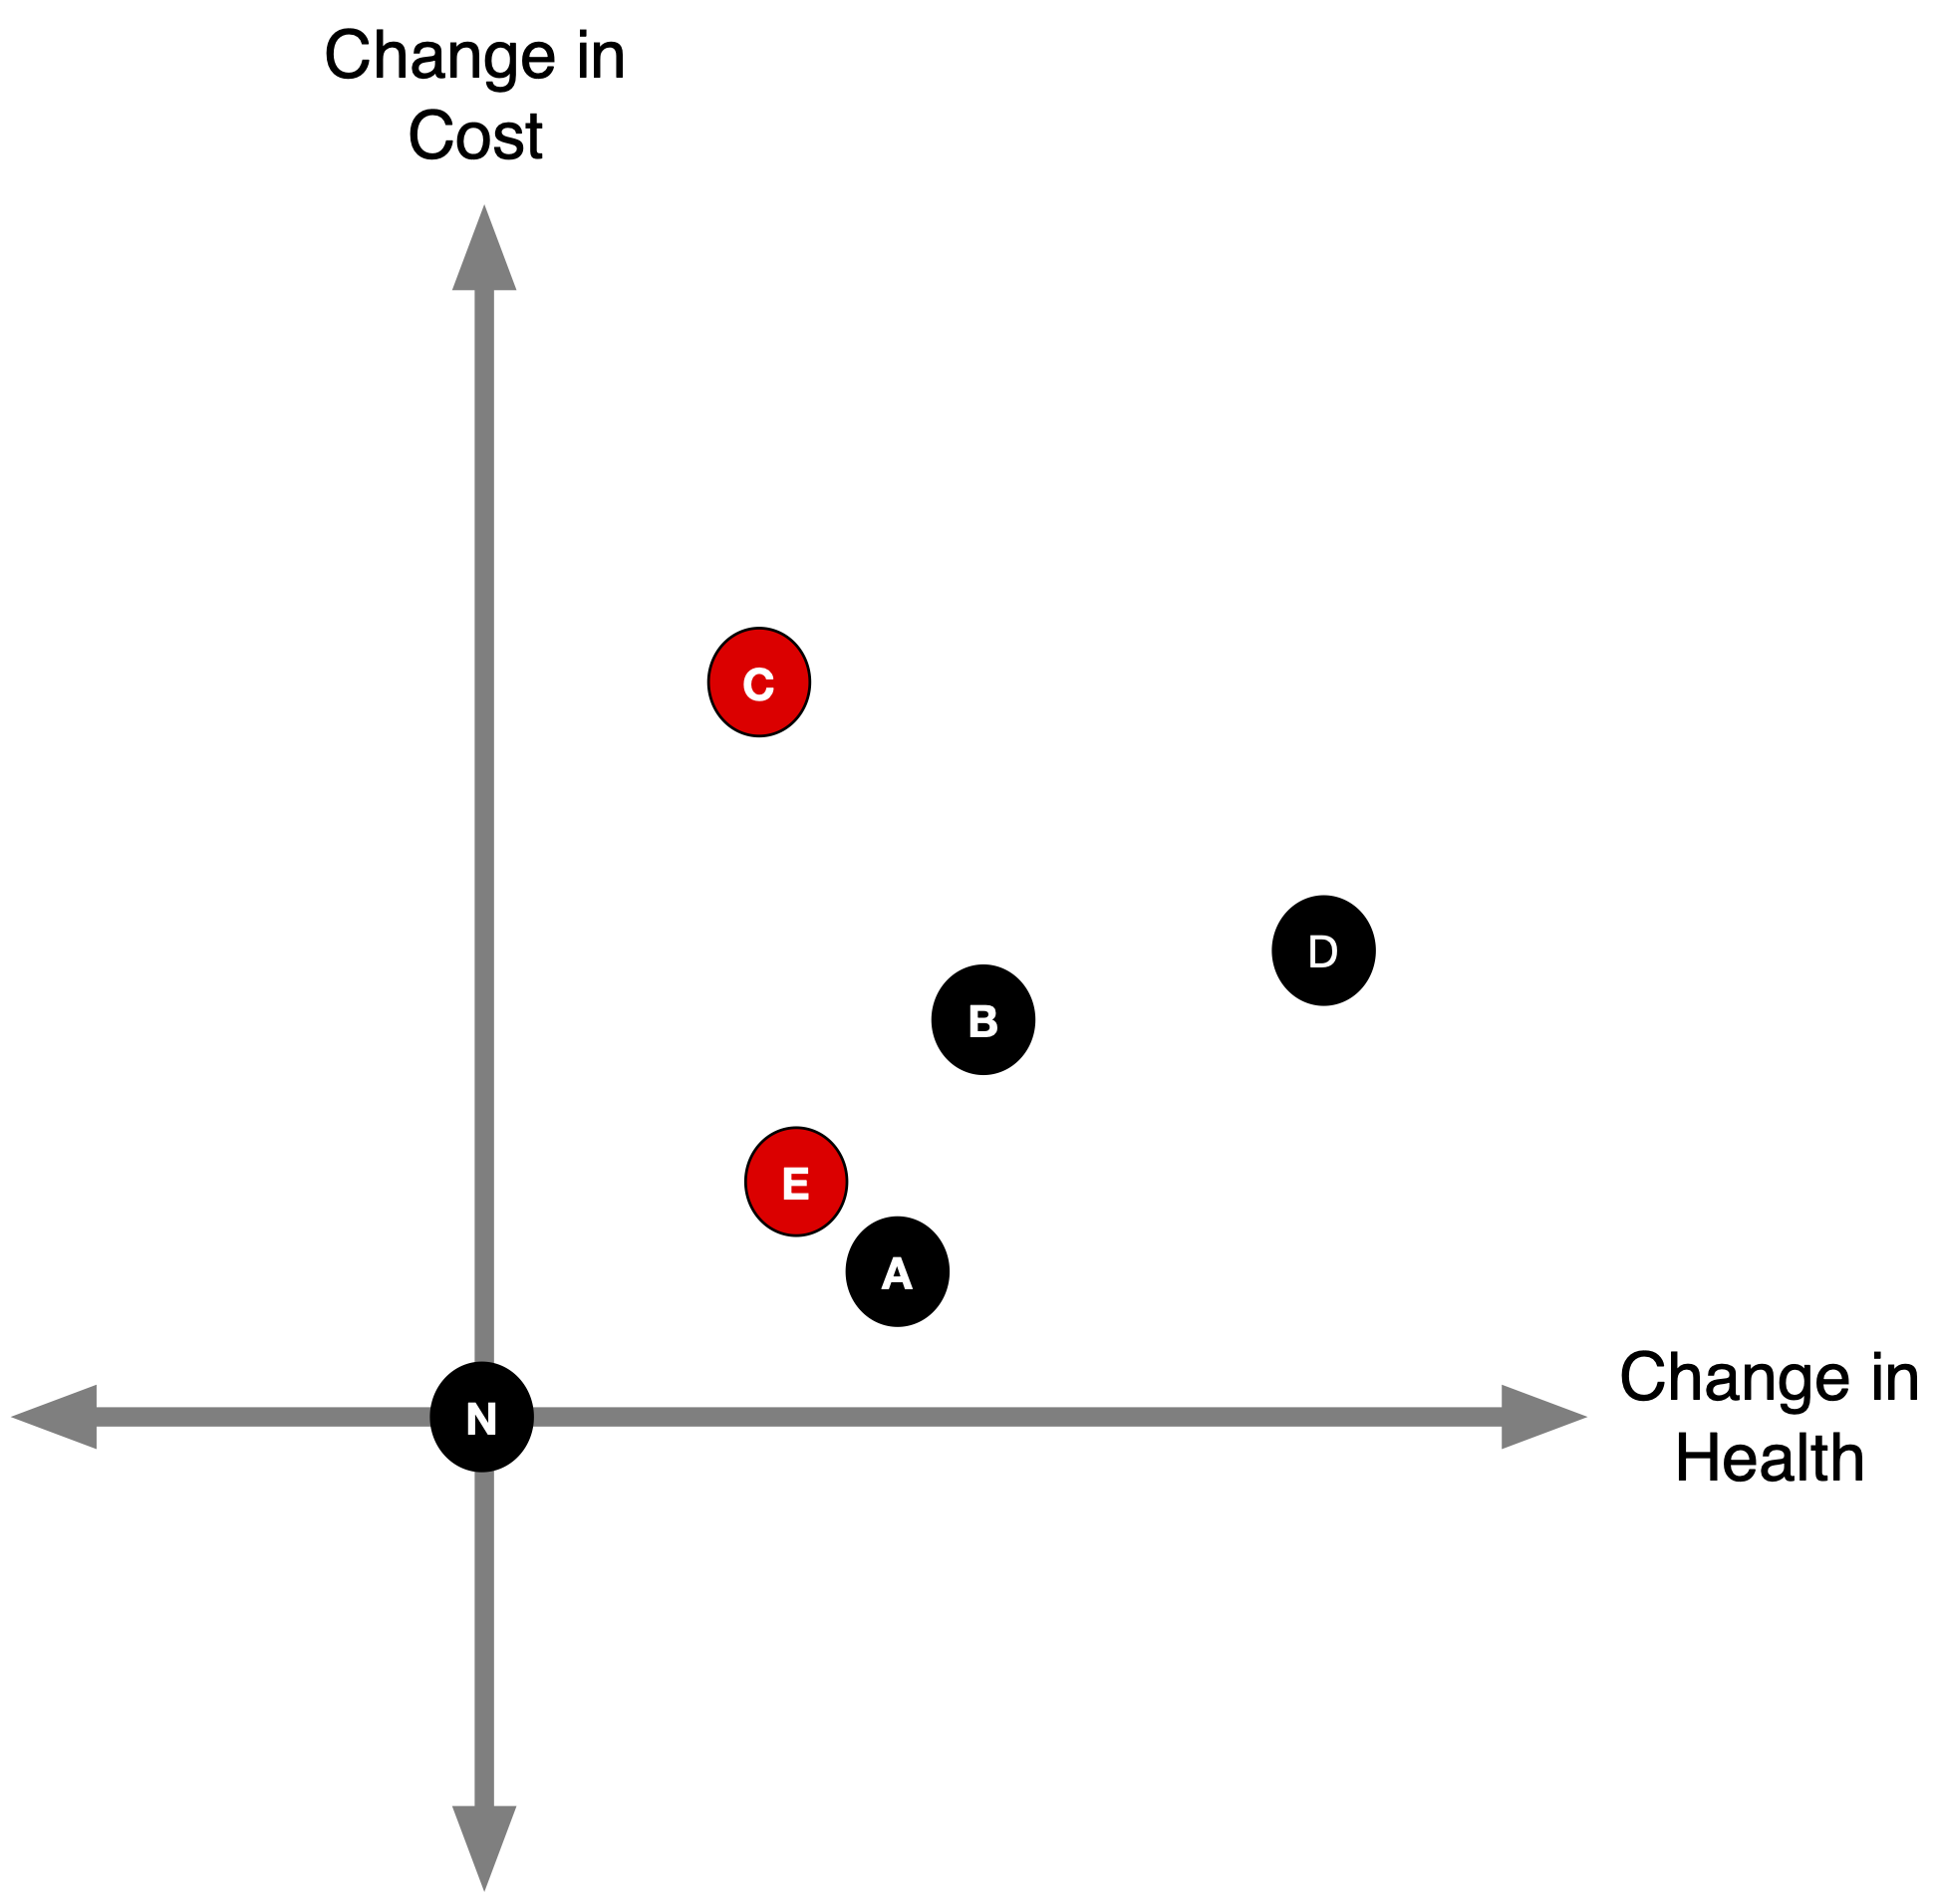
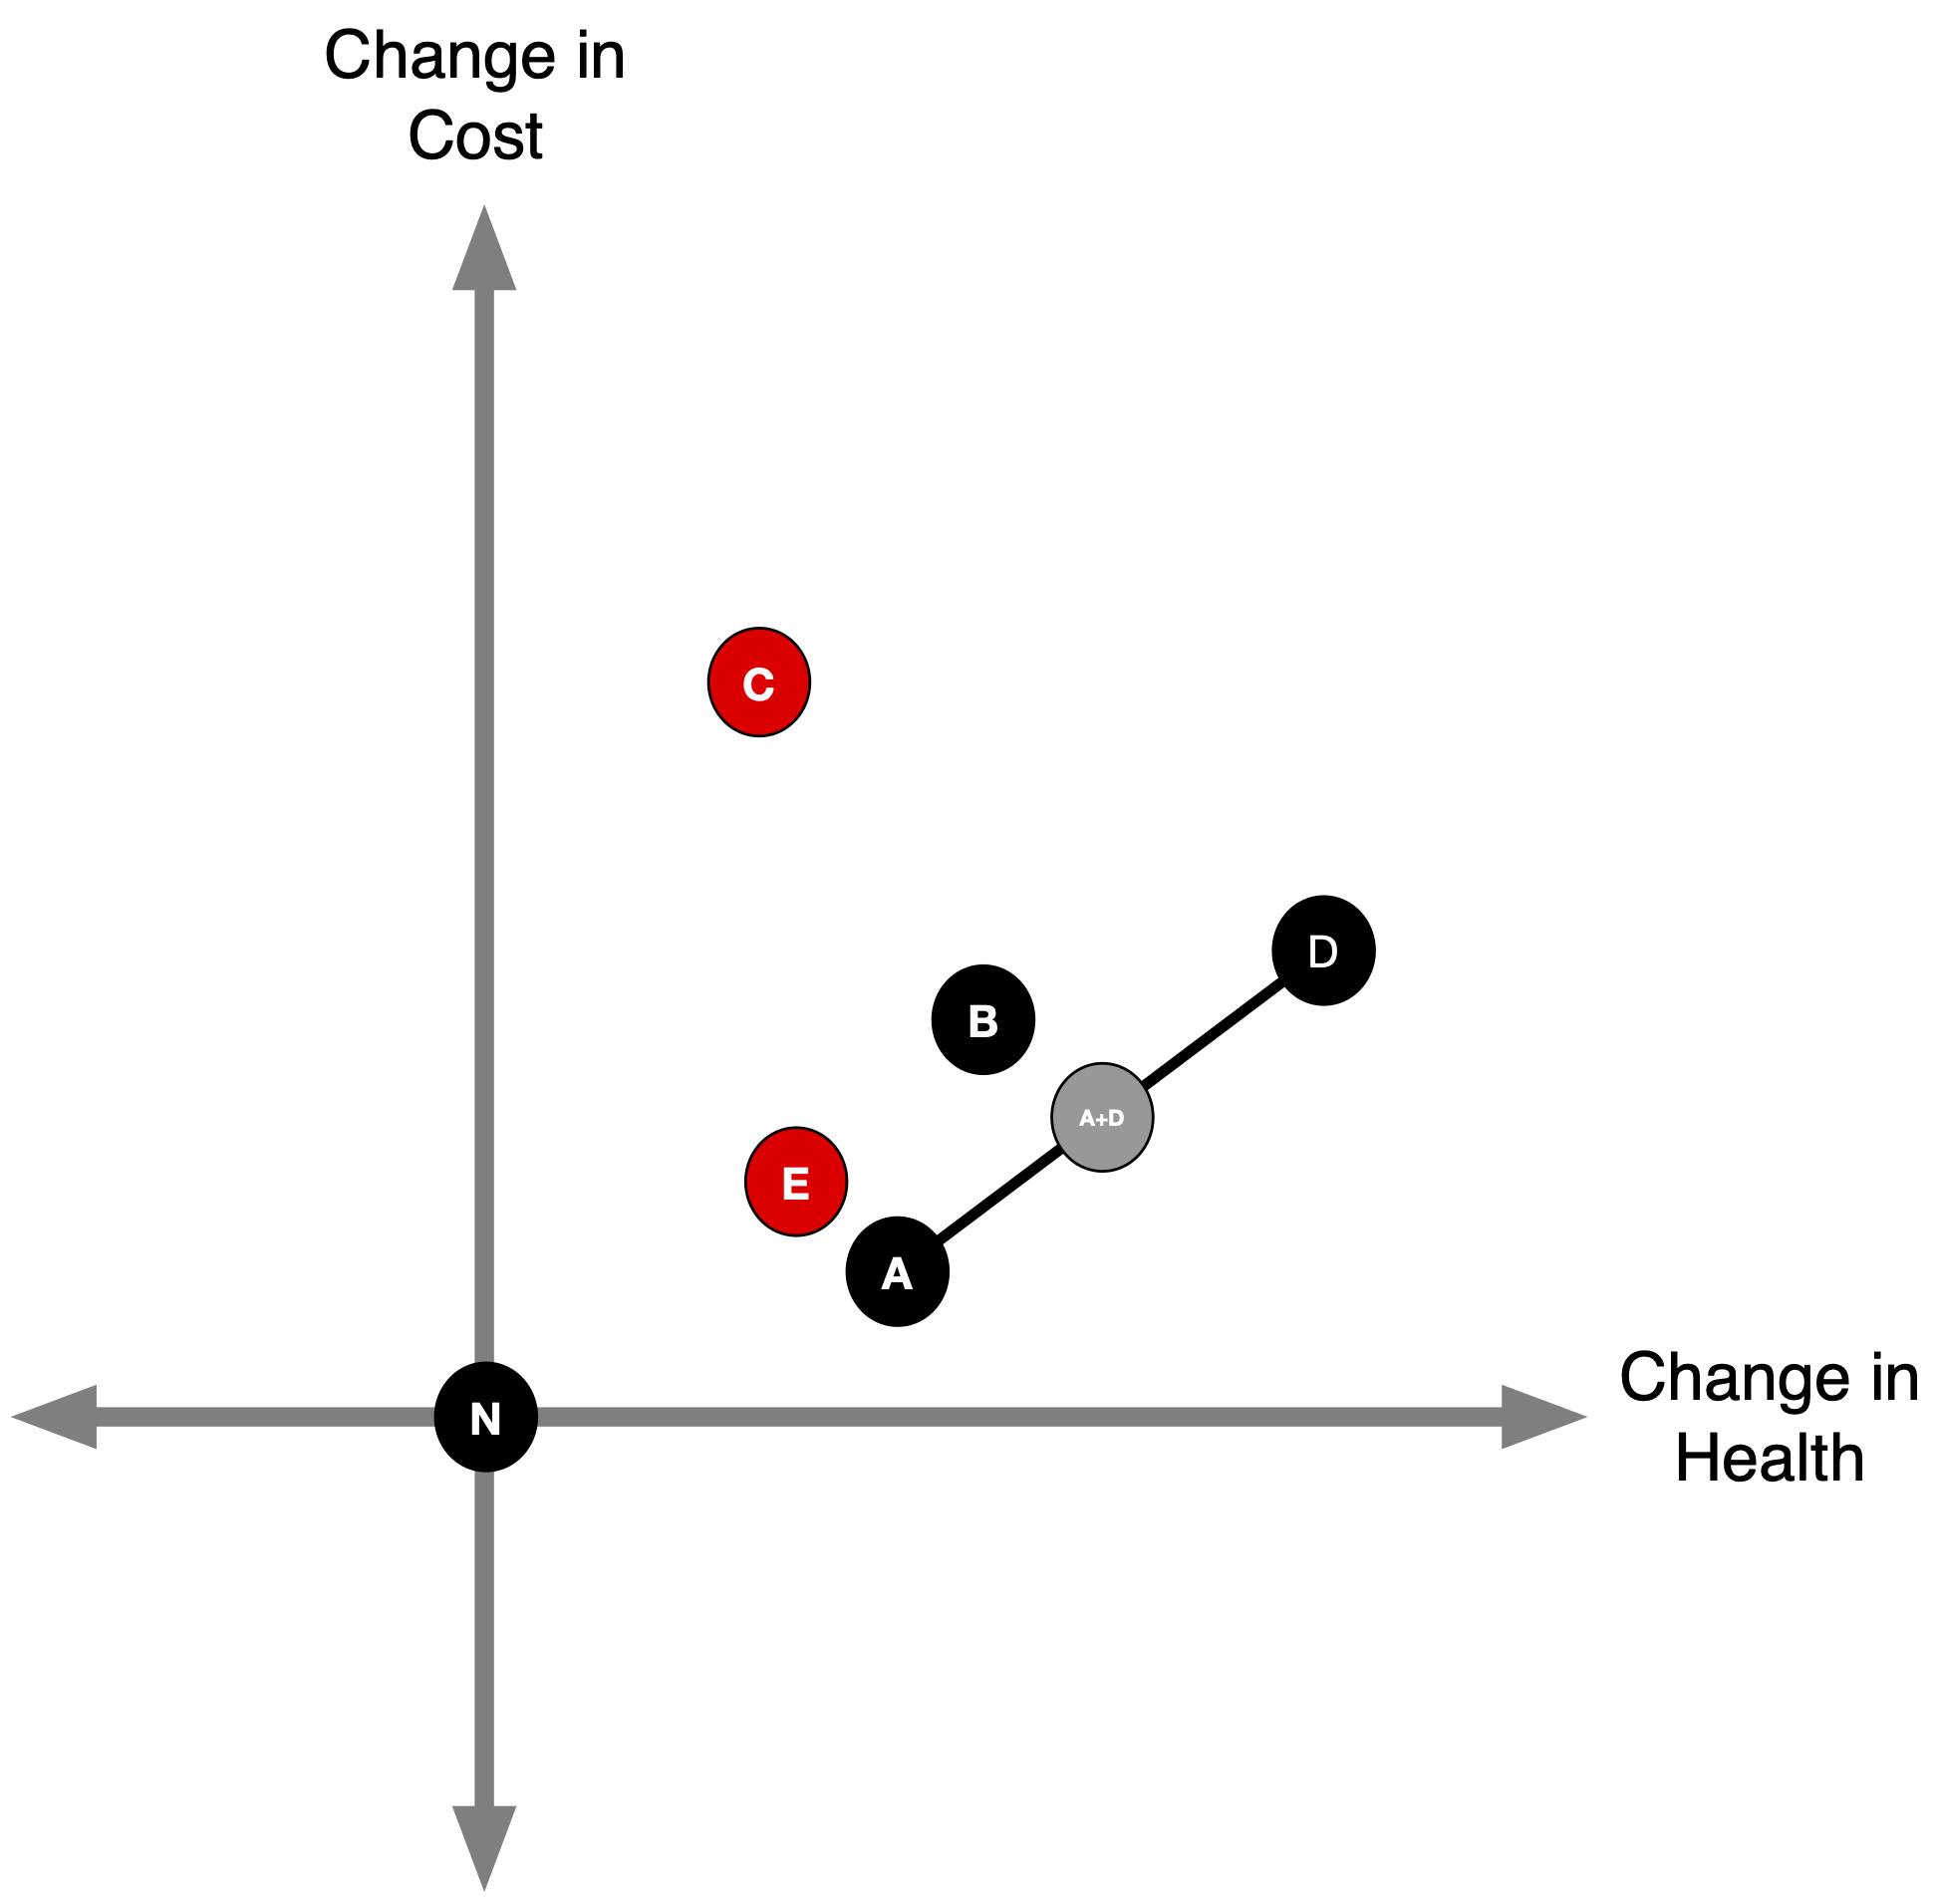
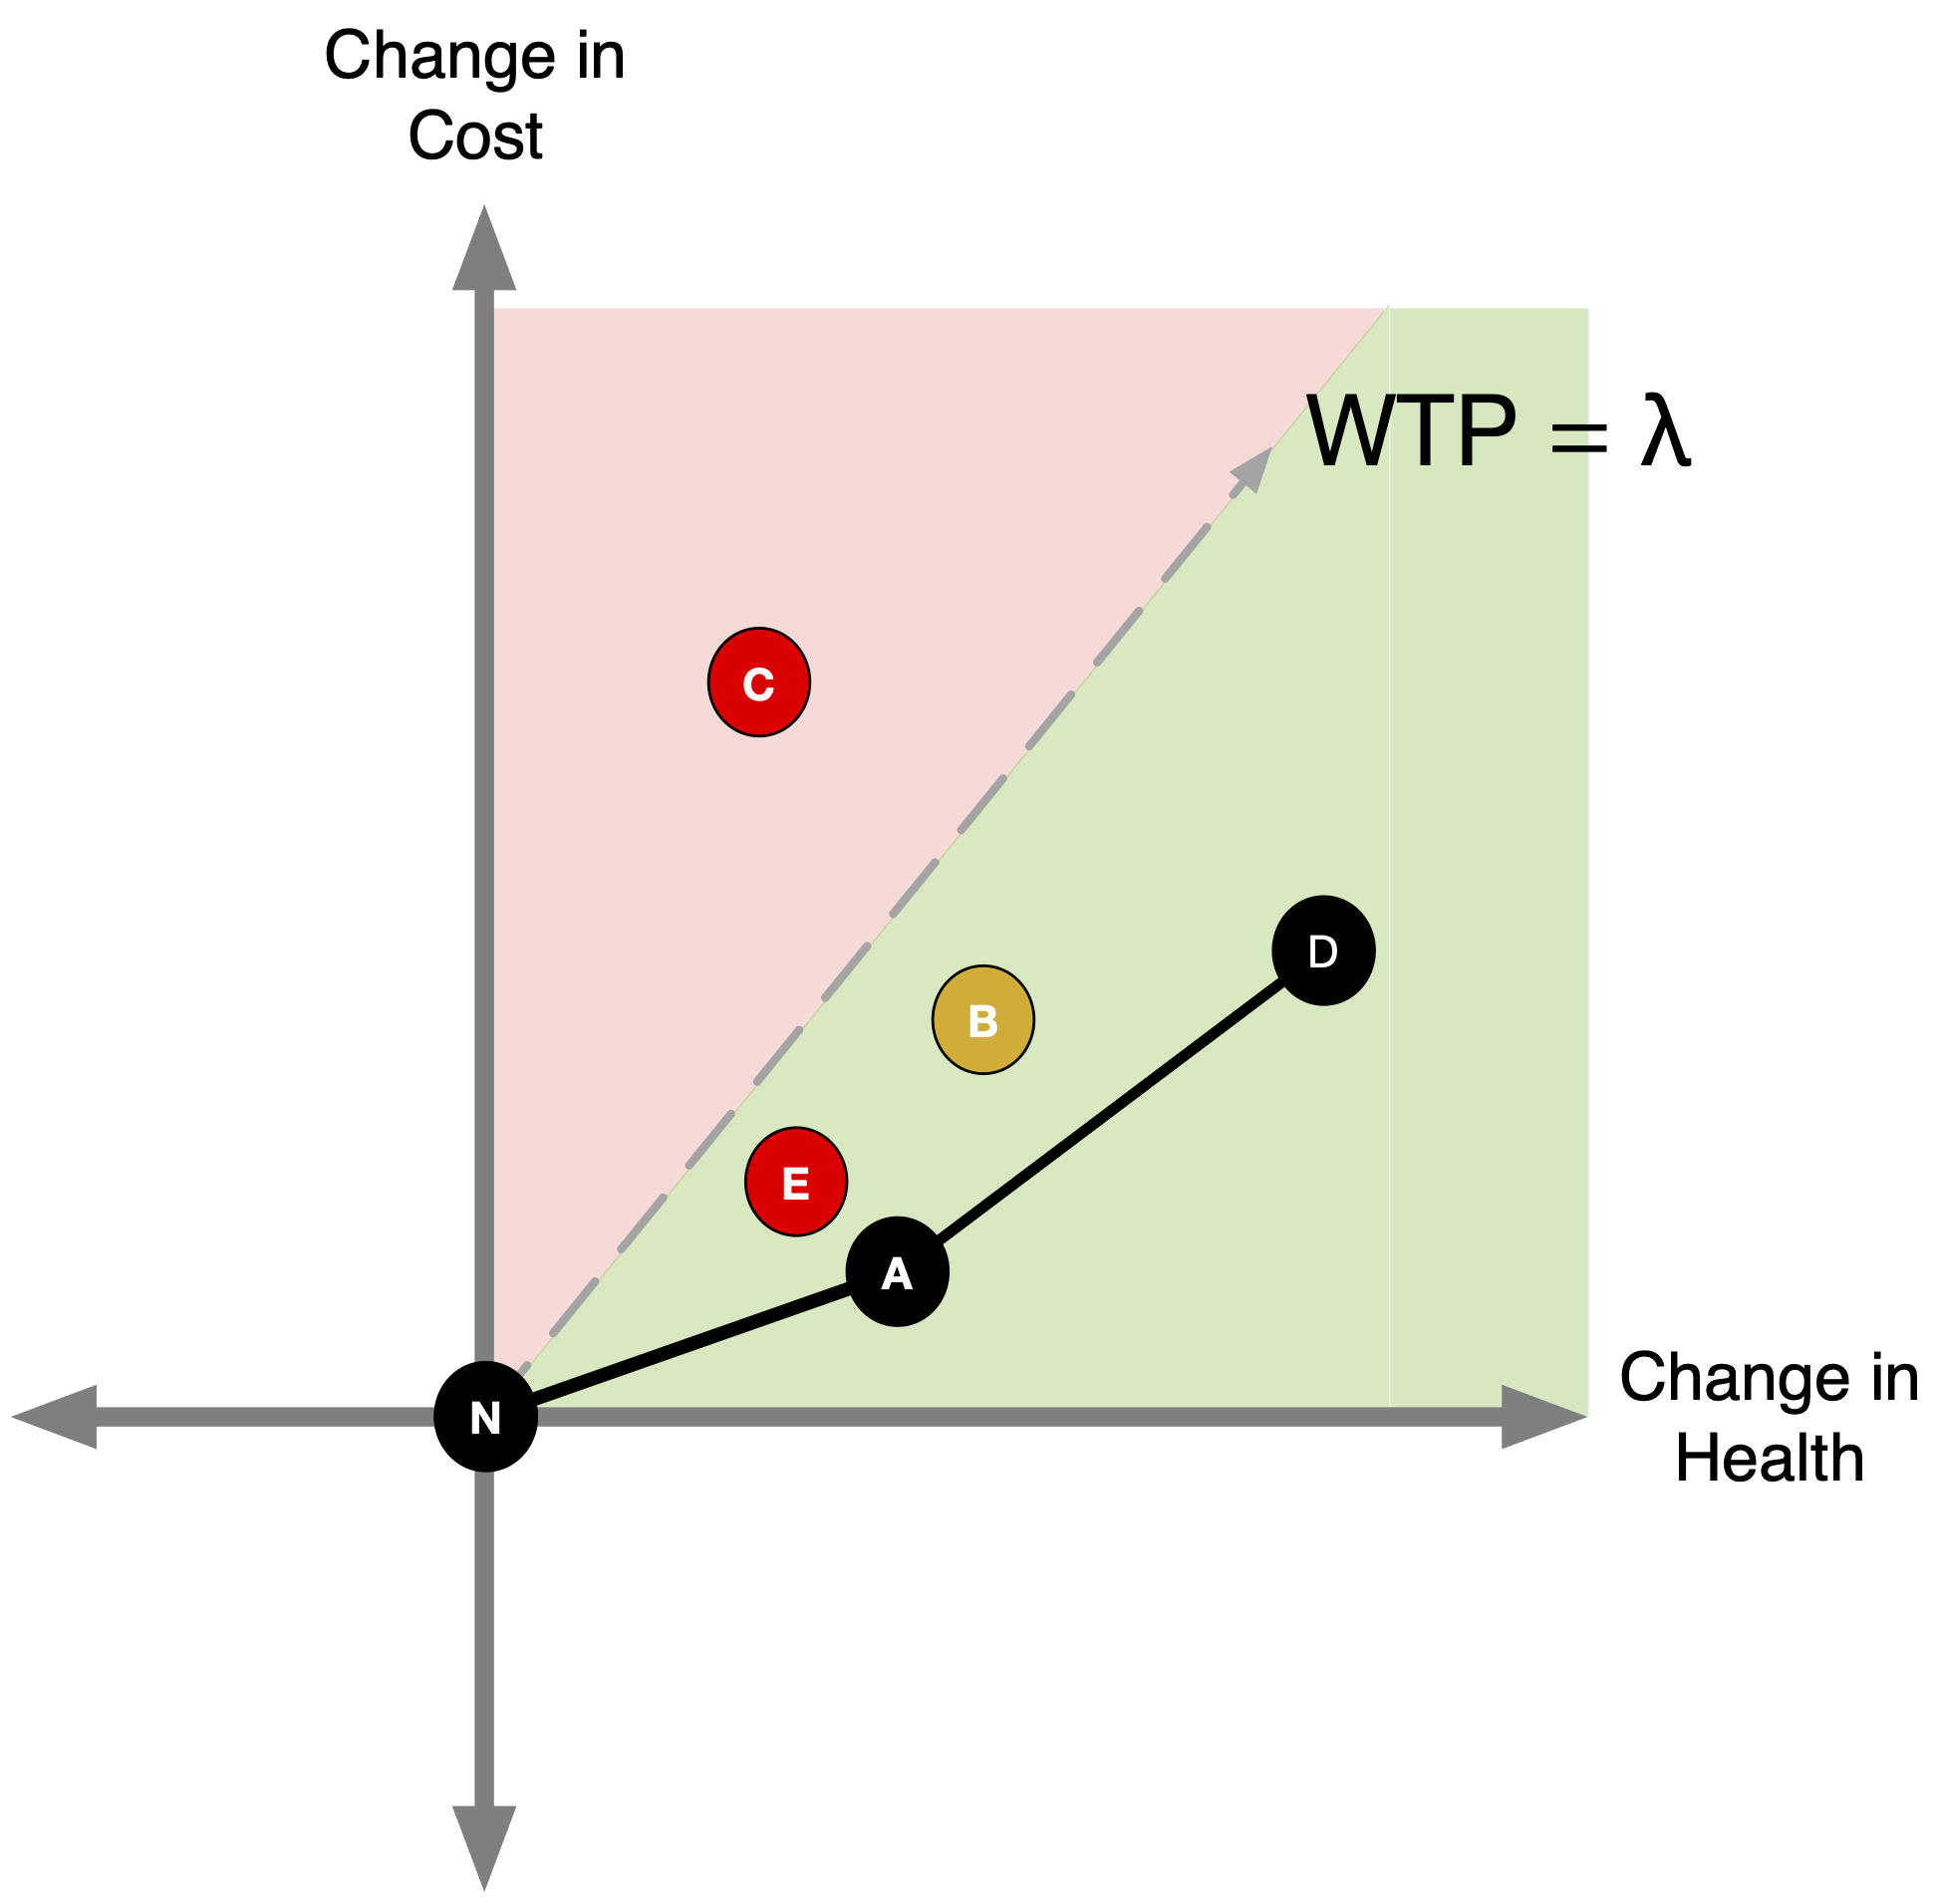
Hybrid Strategies
- Suppose it is feasible to partially implement strategies A and D .
For example, we could implement A for 90% of the population and D for 10% of the population, or vice versa.
90% A, 10% D
Hybrid Strategies
- Suppose it is feasible to partially implement strategies A and D .
For example, we could implement A for 10% of the population and D for 90% of the population, or vice versa.
10% A, 90% D
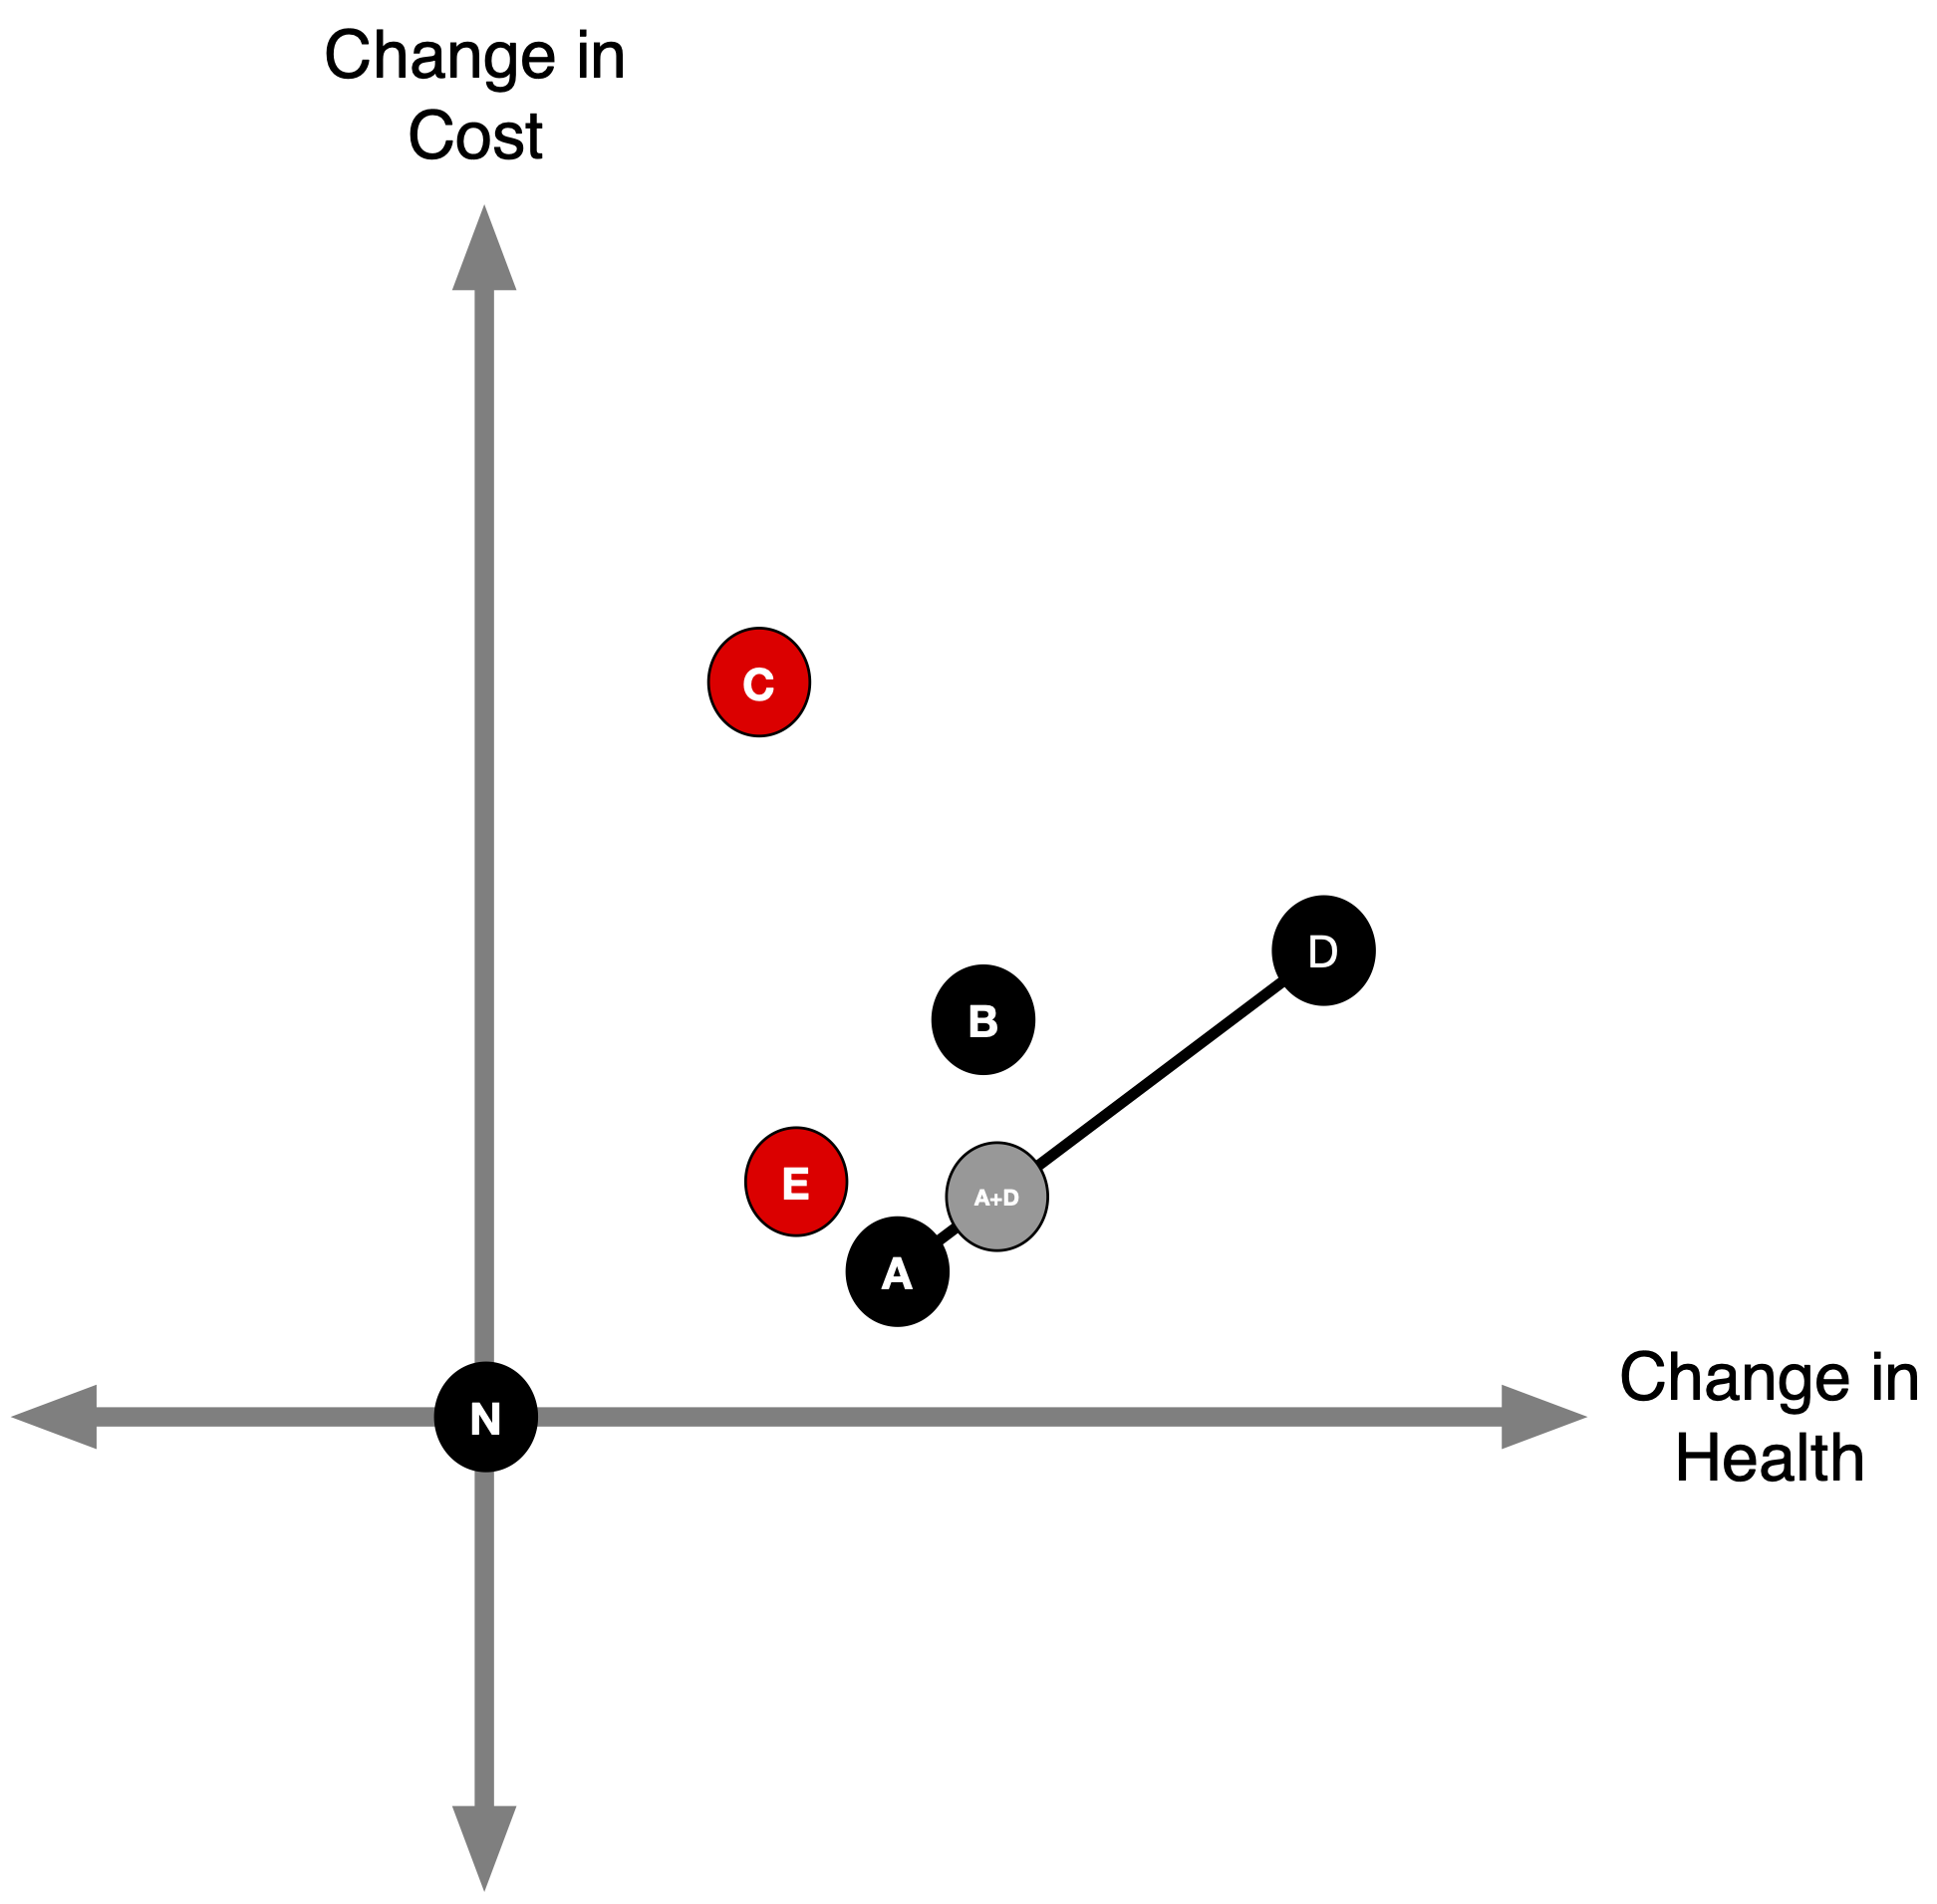
Hybrid Strategies
- Suppose it is feasible to partially implement strategies A and D .
For example, we could implement A for 50% of the population and D for 50% of the population, or vice versa.
Can we make any statements about B now?
50% A, 50% D
Extended (Weak) Dominance
- B is ruled out by extended (“weak”) dominance.
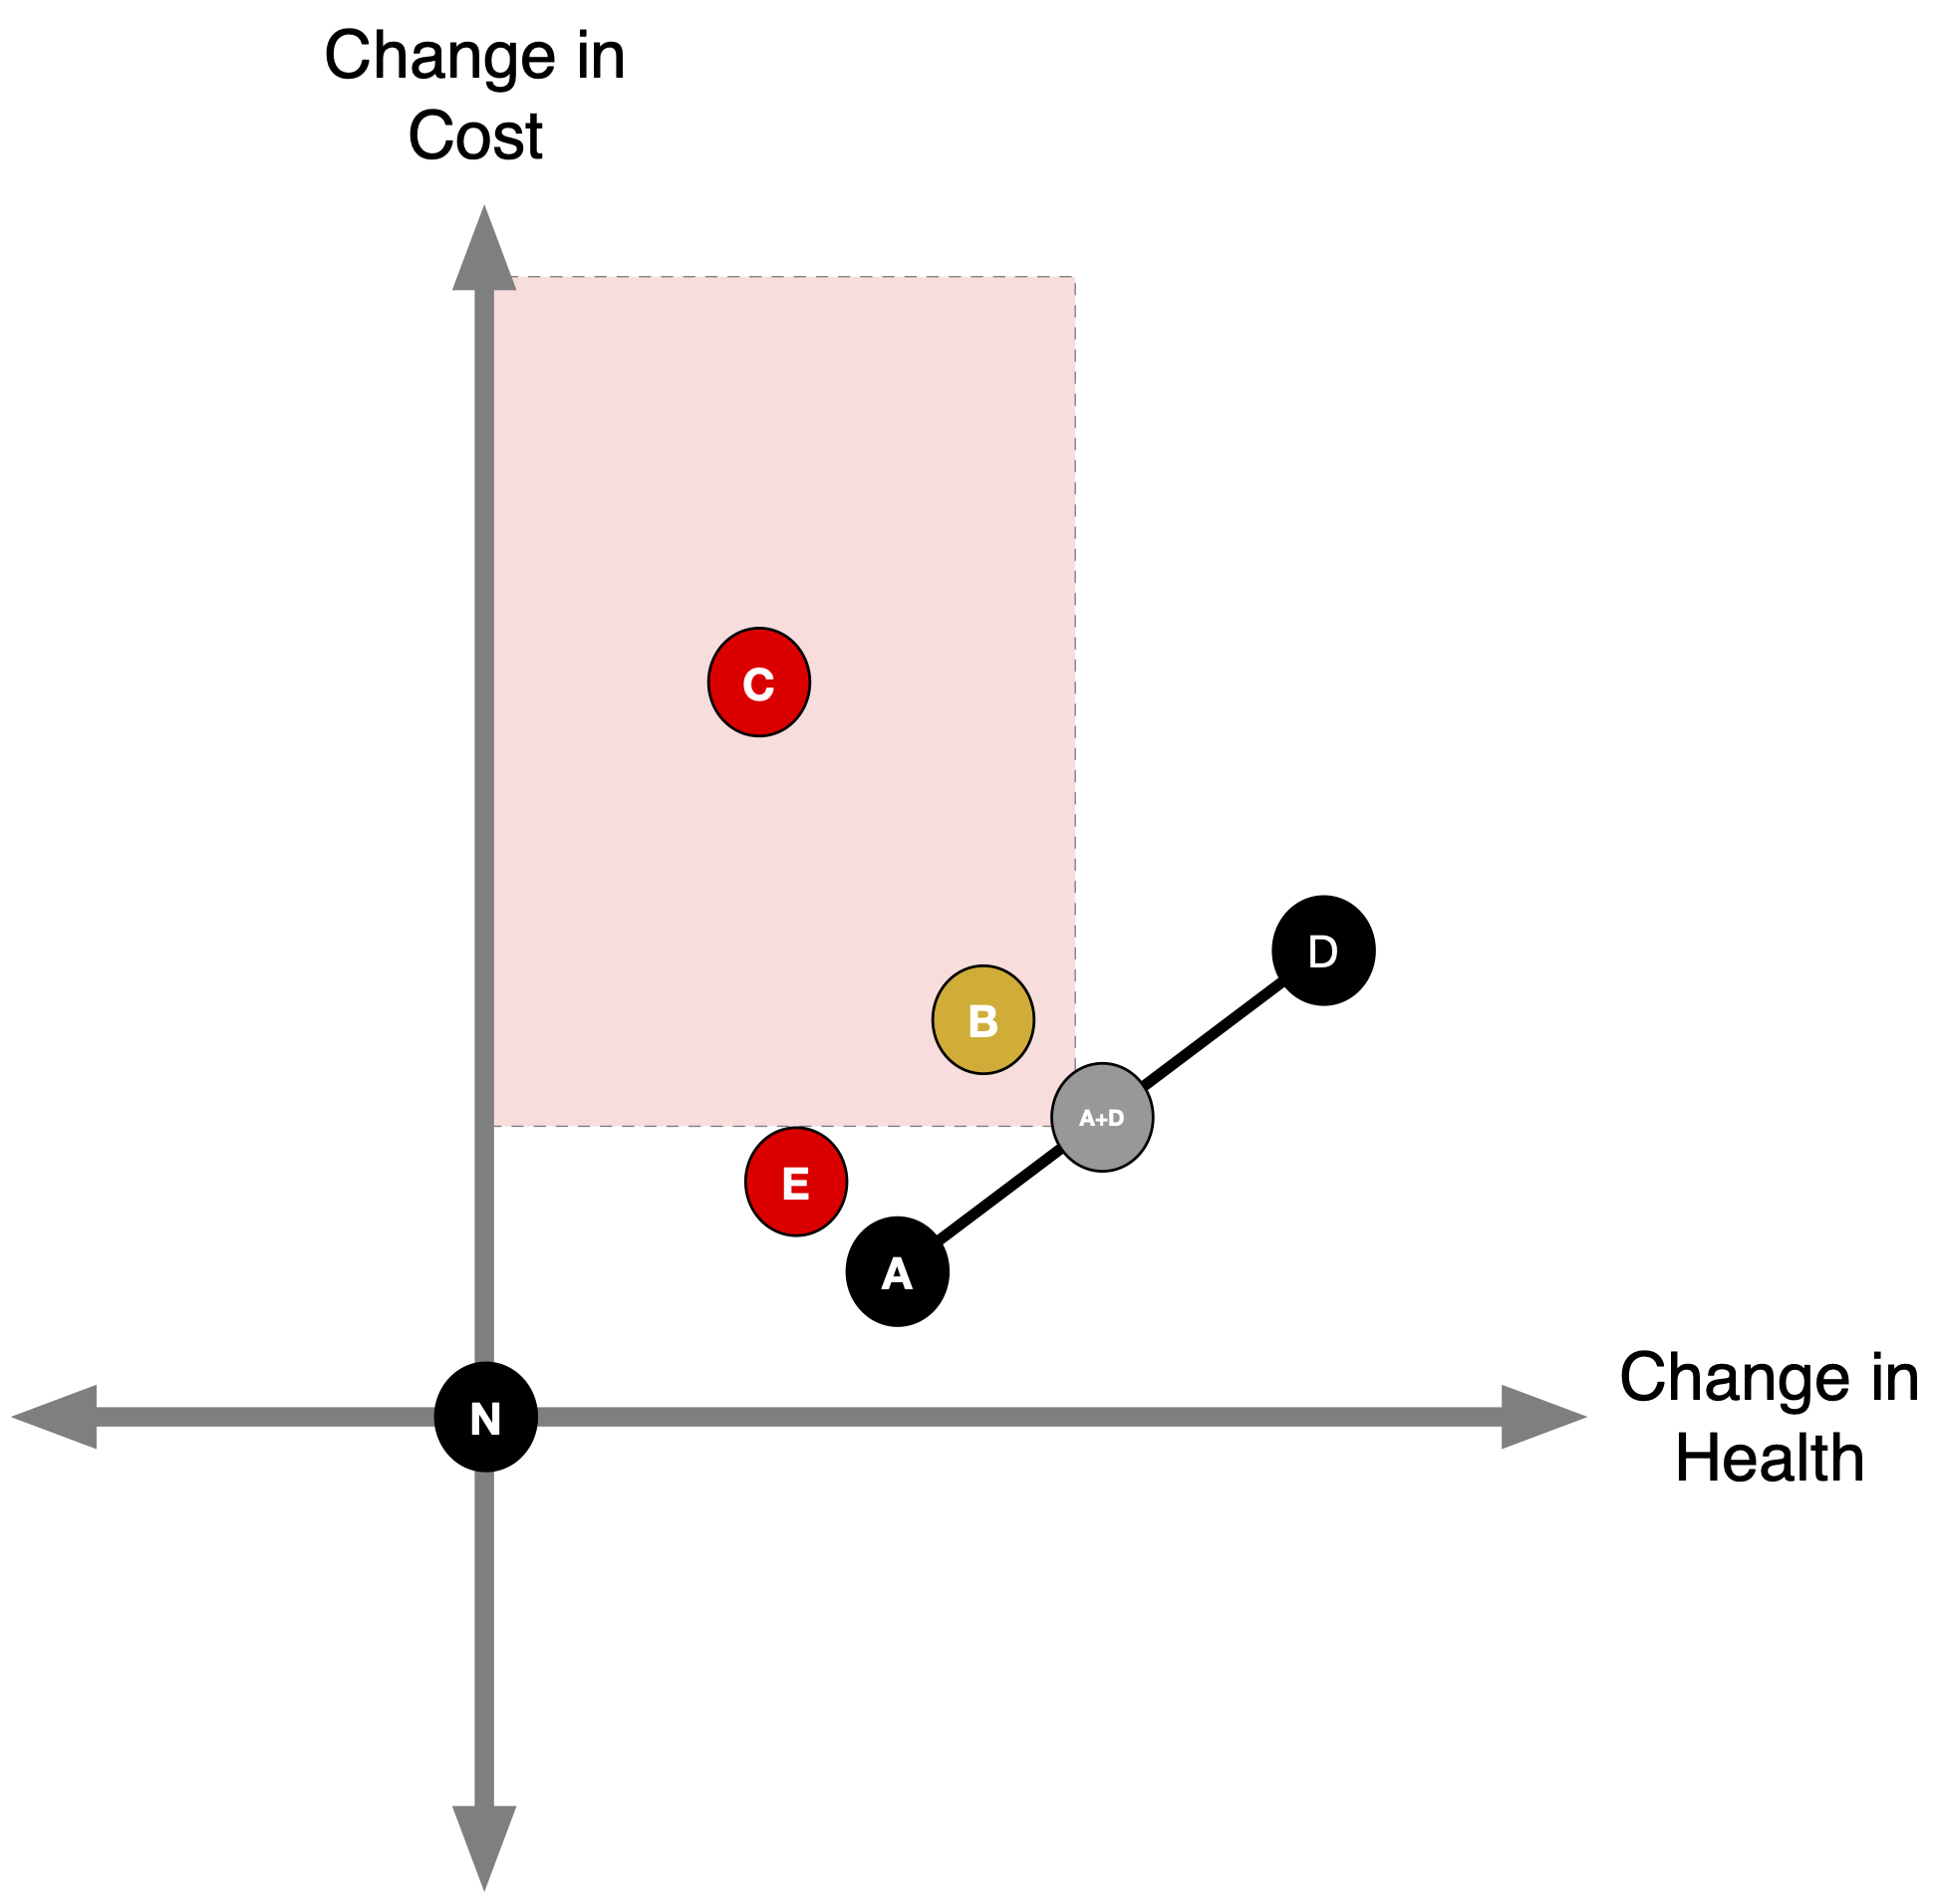
Efficiency Frontier
- The efficiency frontier is the set of non-dominated strategies: Lower & right = better (more effective and less costly).
- Any point above the A-D line (like B) delivers fewer QALYs per dollar than the A–D mix.
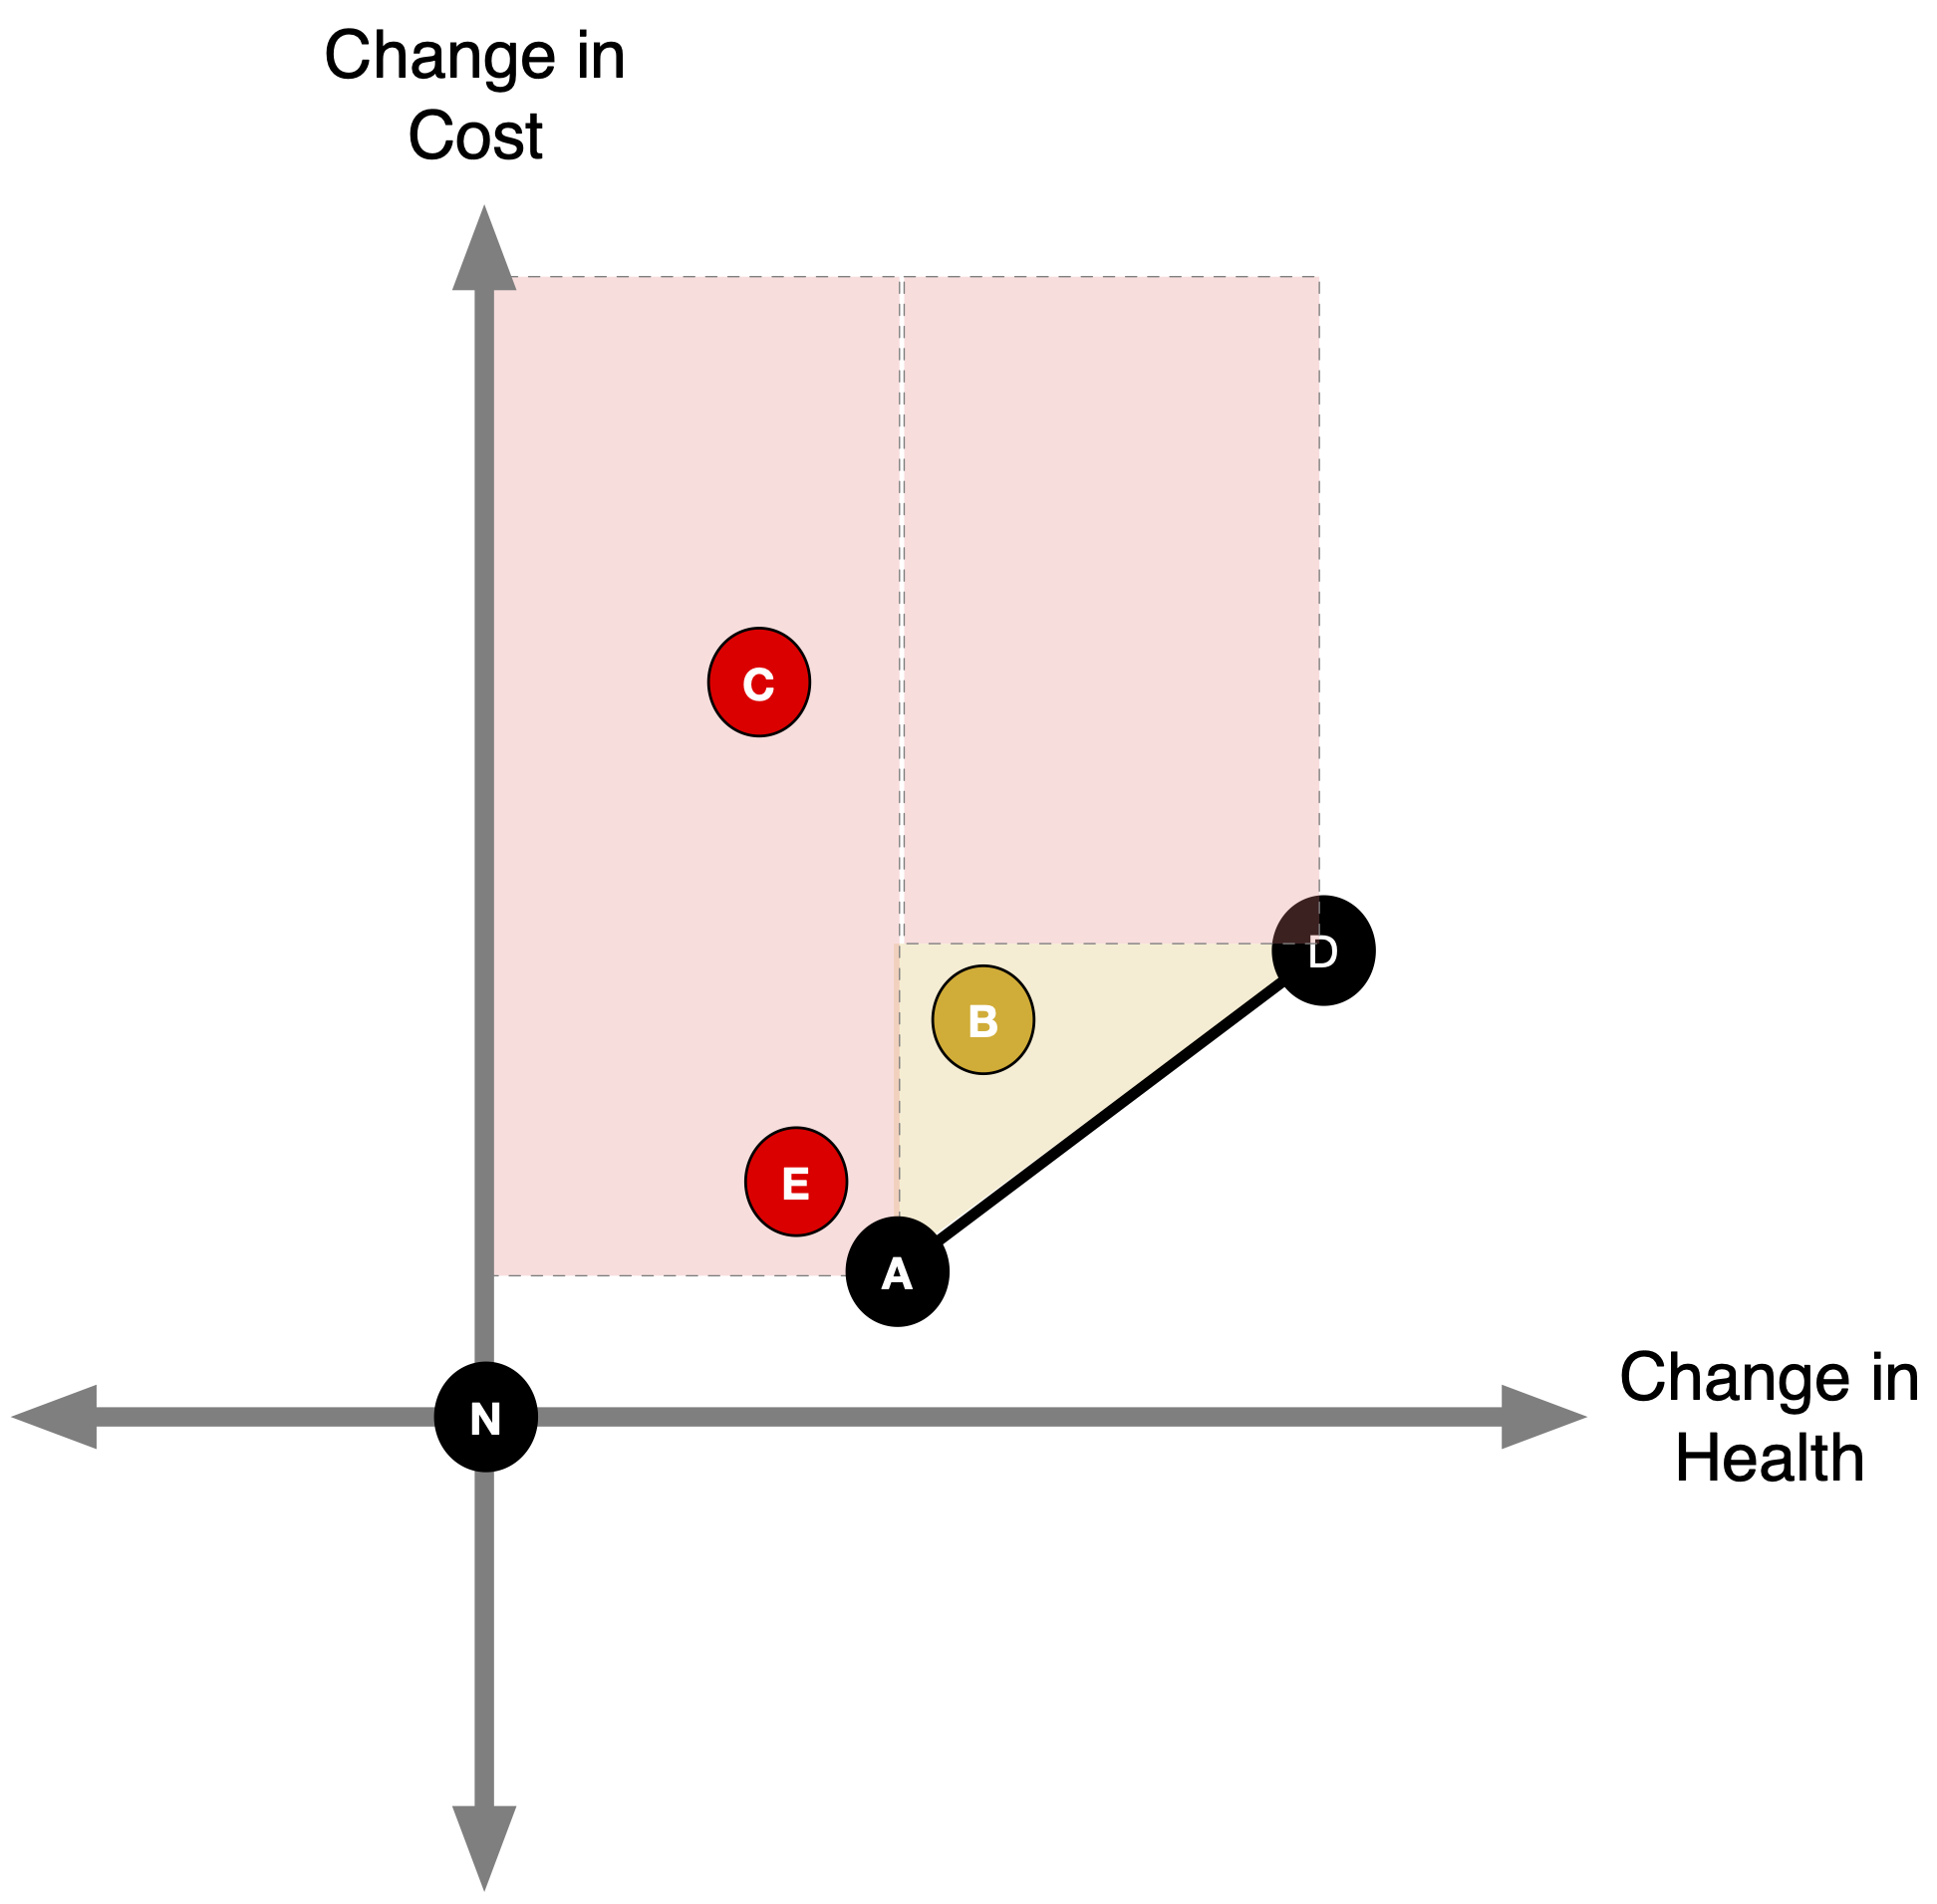
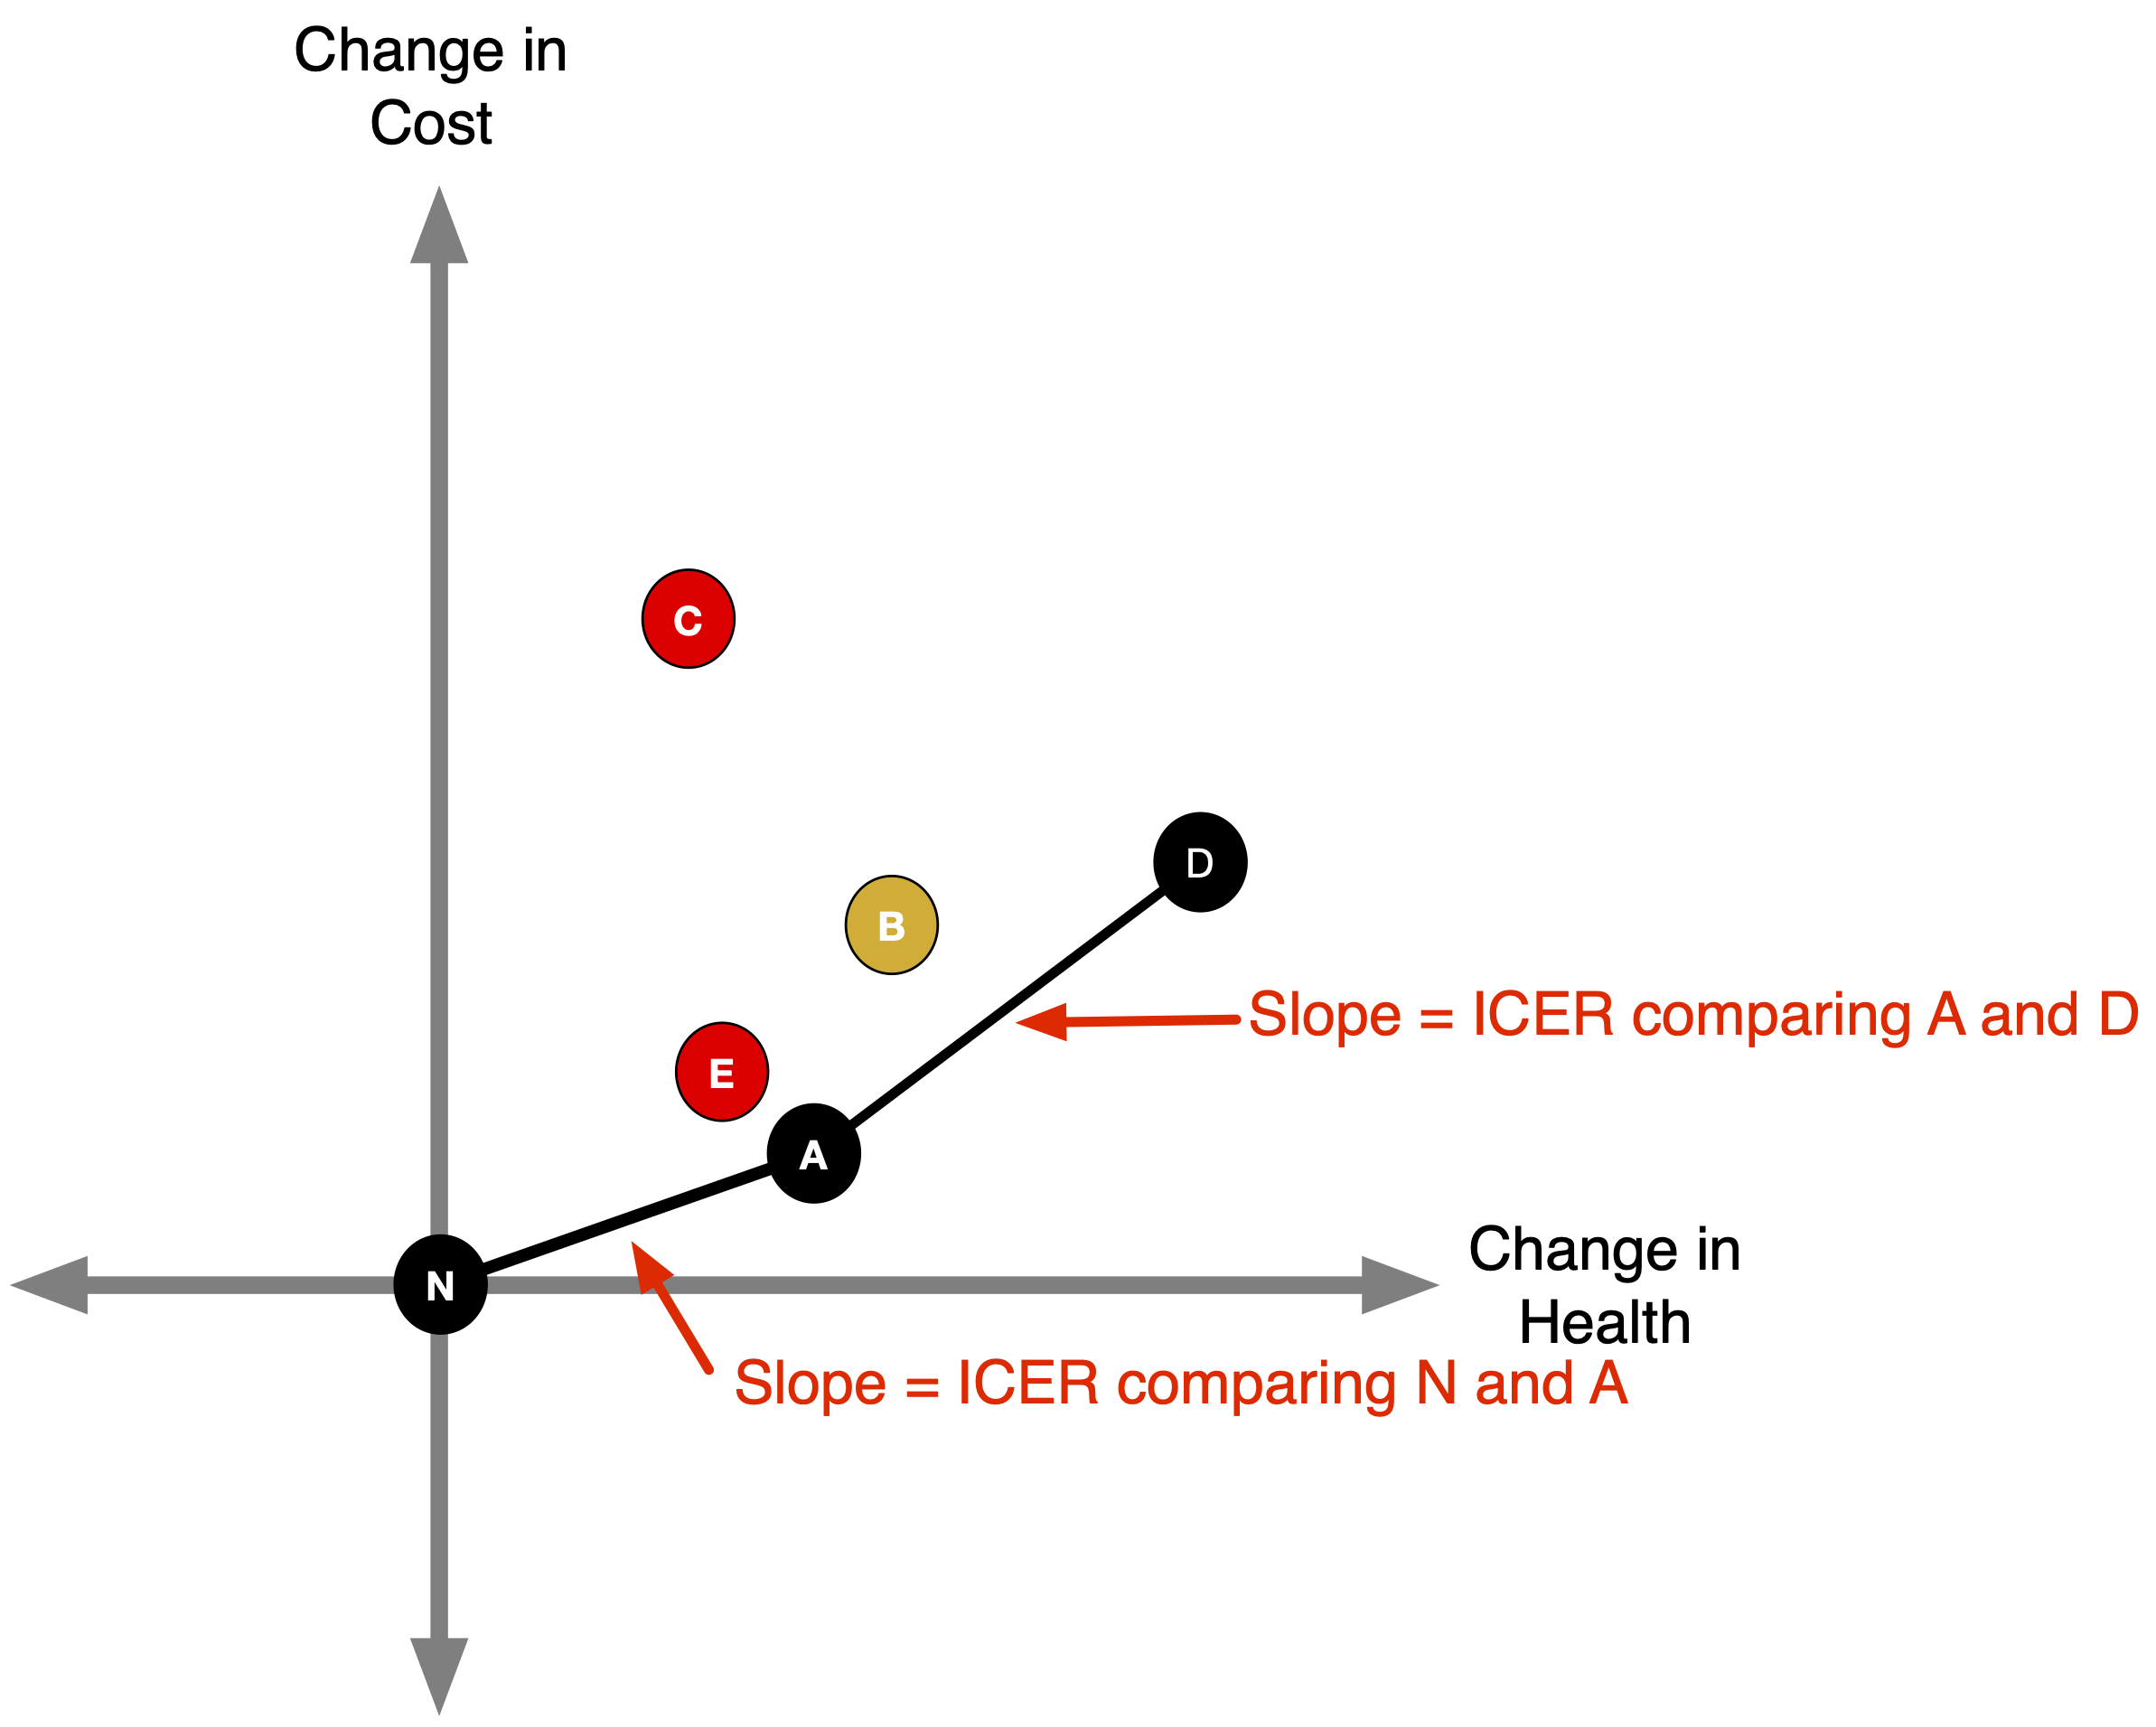
ICERs
The slope of a line connecting two points is the incremental cost-effectiveness ratio comparing those strategies.
More on this later!
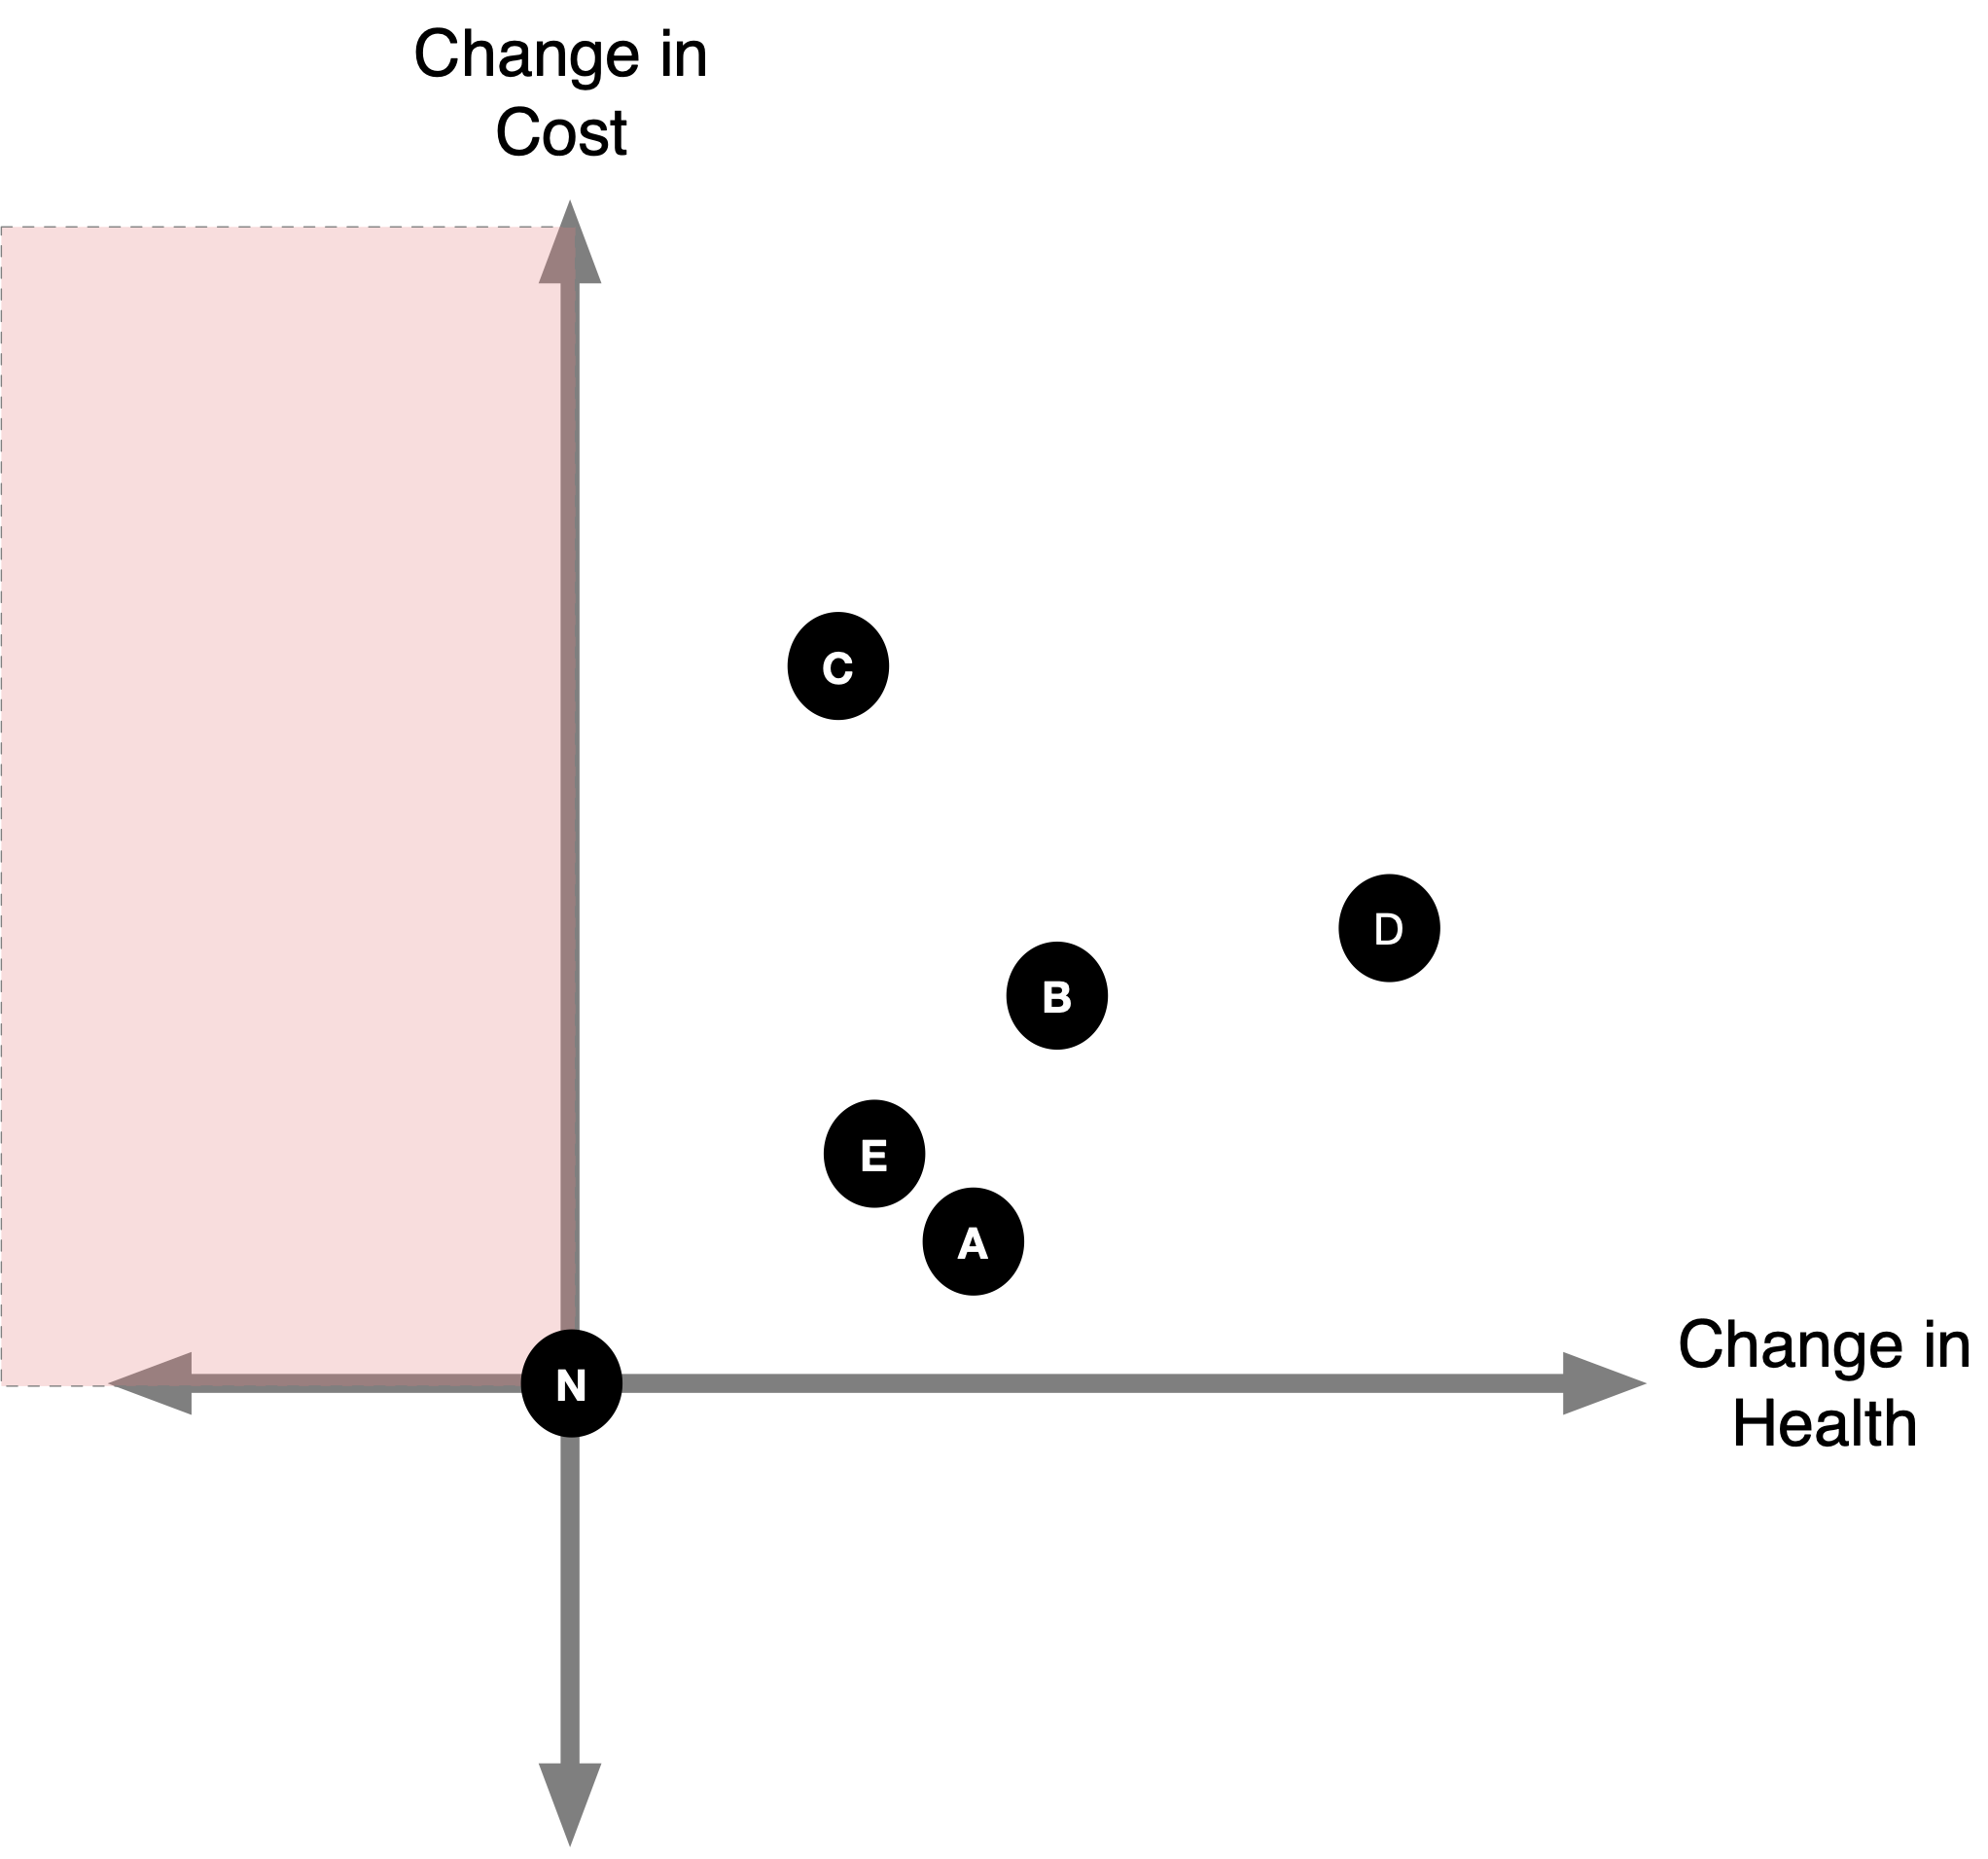
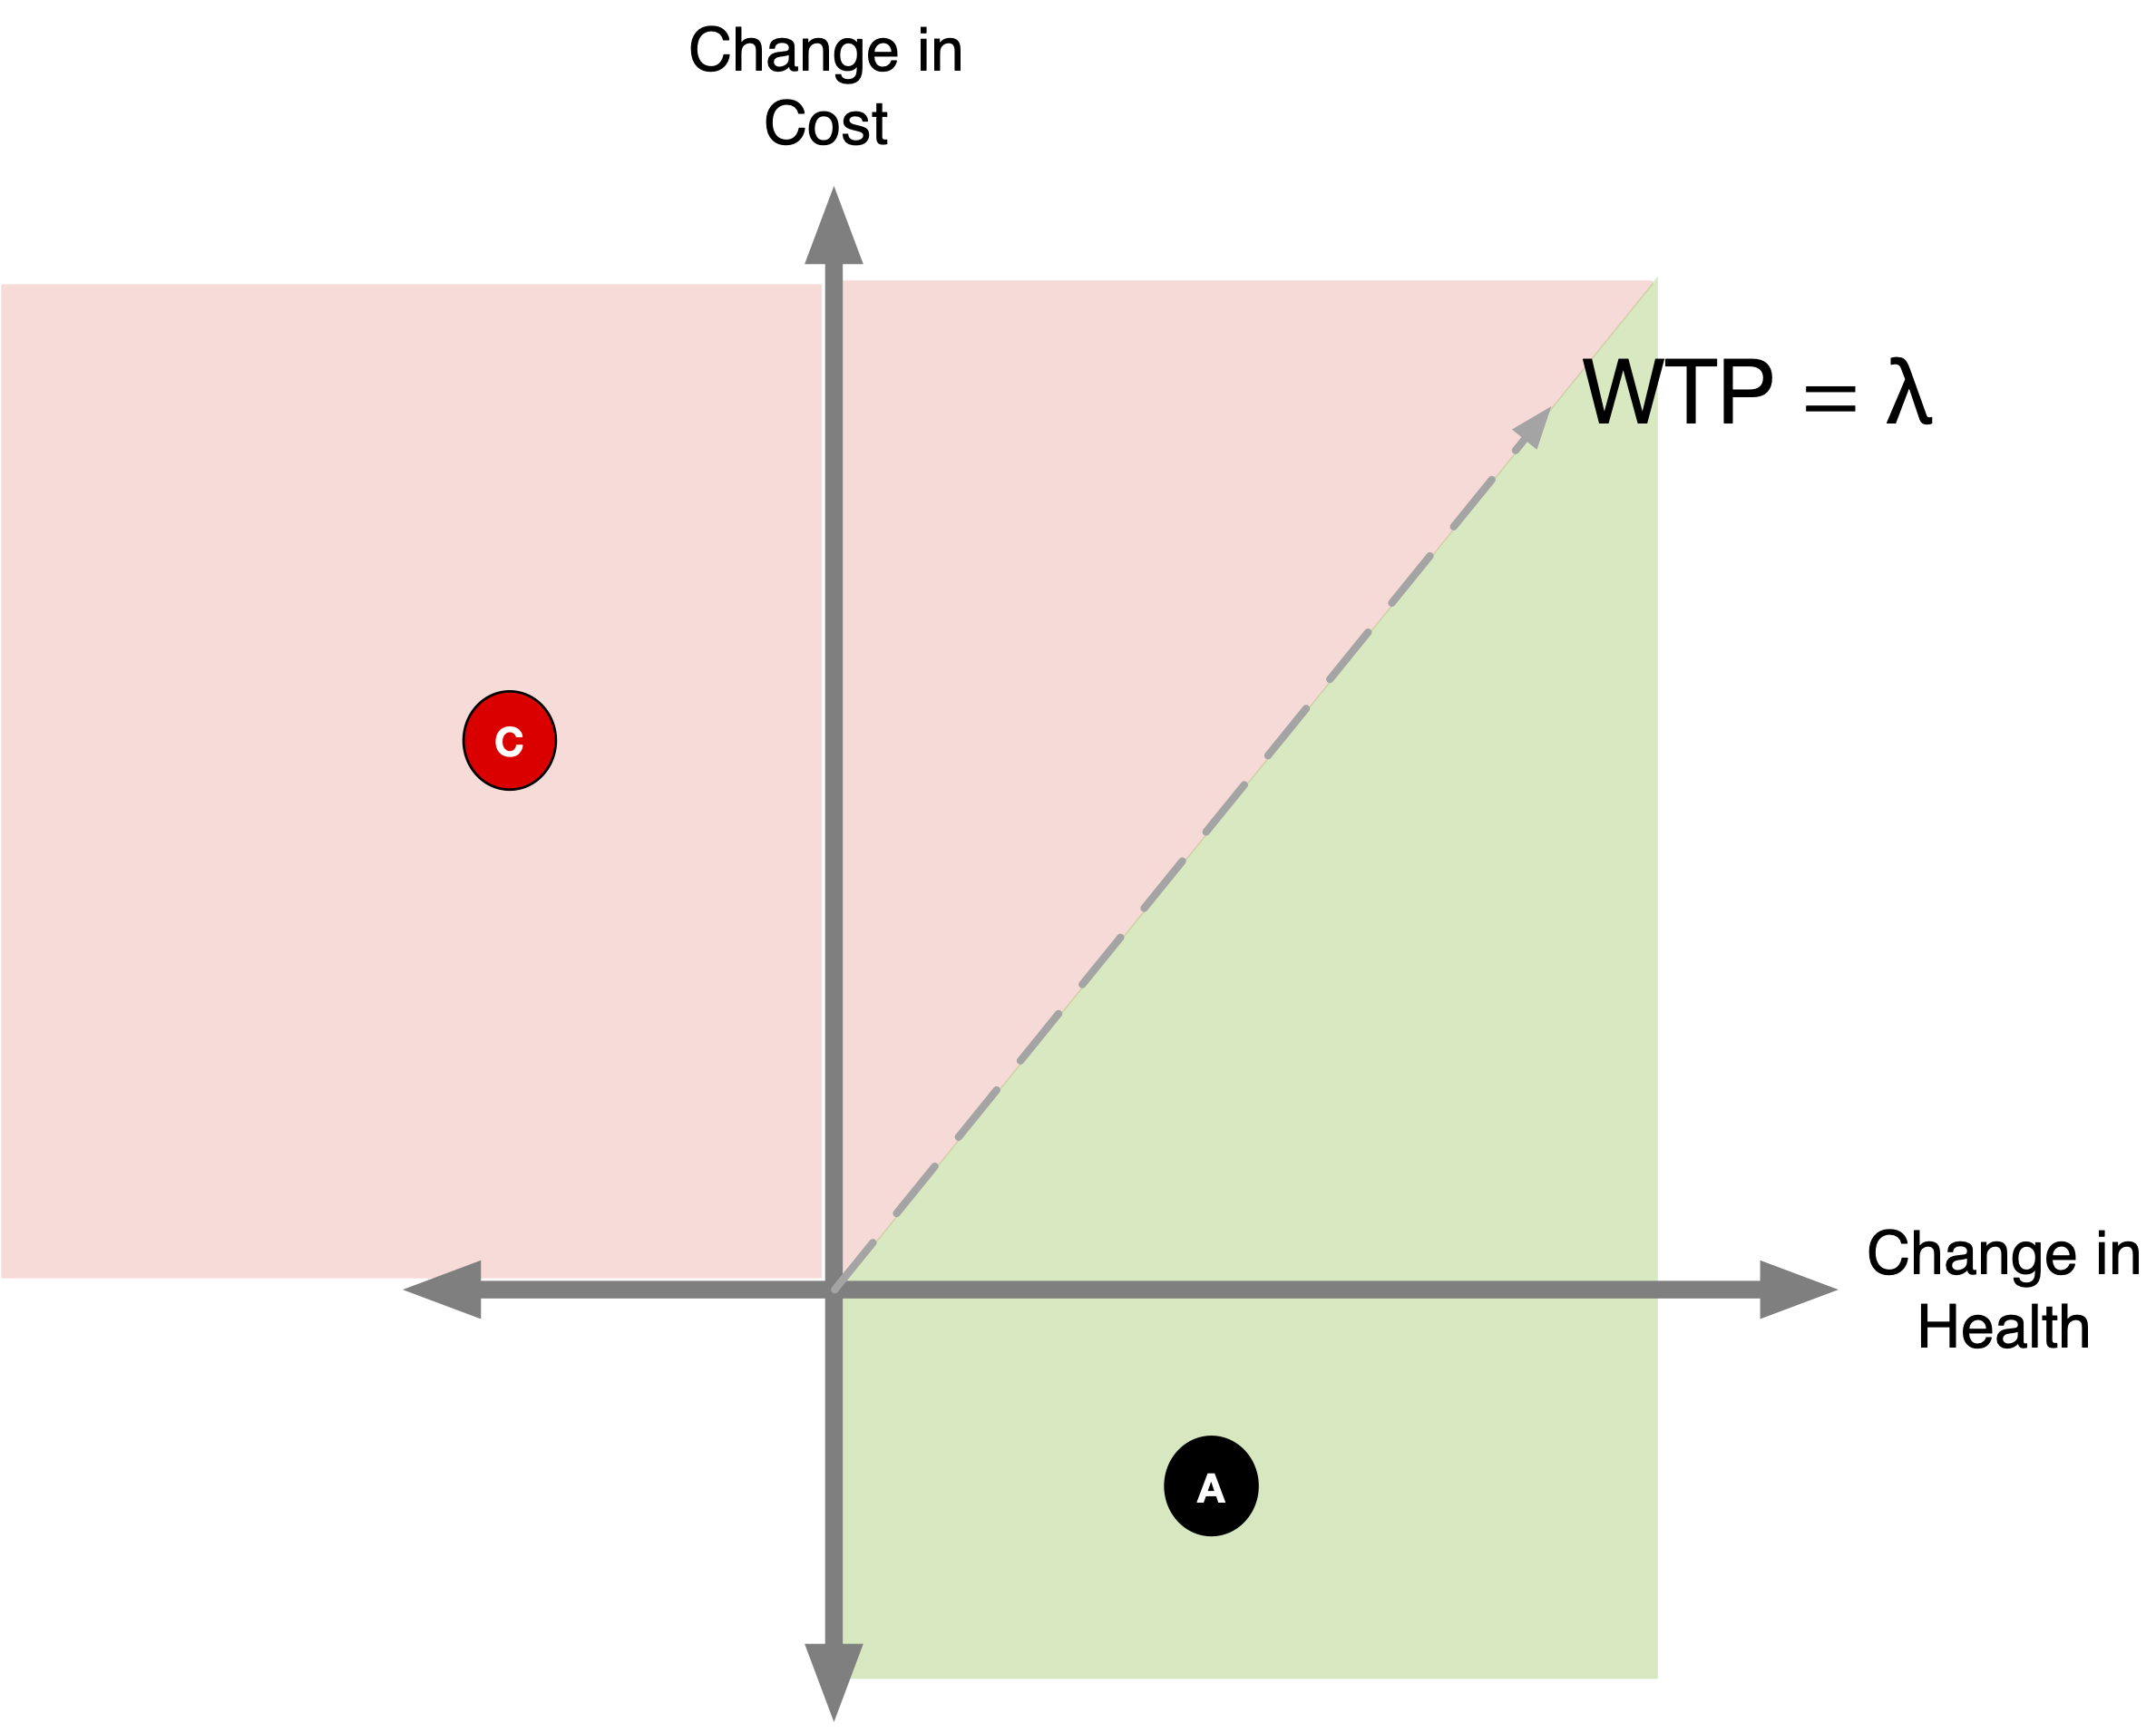
A Brief Aside on Negative ICERs
- We want to rule out strategies that cost more but result in less health.
- This implies a negative ICER.
- But what other scenario would result in a negative ICER?
- Strategy adds health but reduces costs.
- This is a great strategy!
Determining Dominated Strategies
- You can see this in the pictures as well ….
- A steeper slope = the “C” (numerator) is increasing faster than “E” (denominator) = less efficient use of resources
A note on COMPARATORS
A note on COMPARATORS
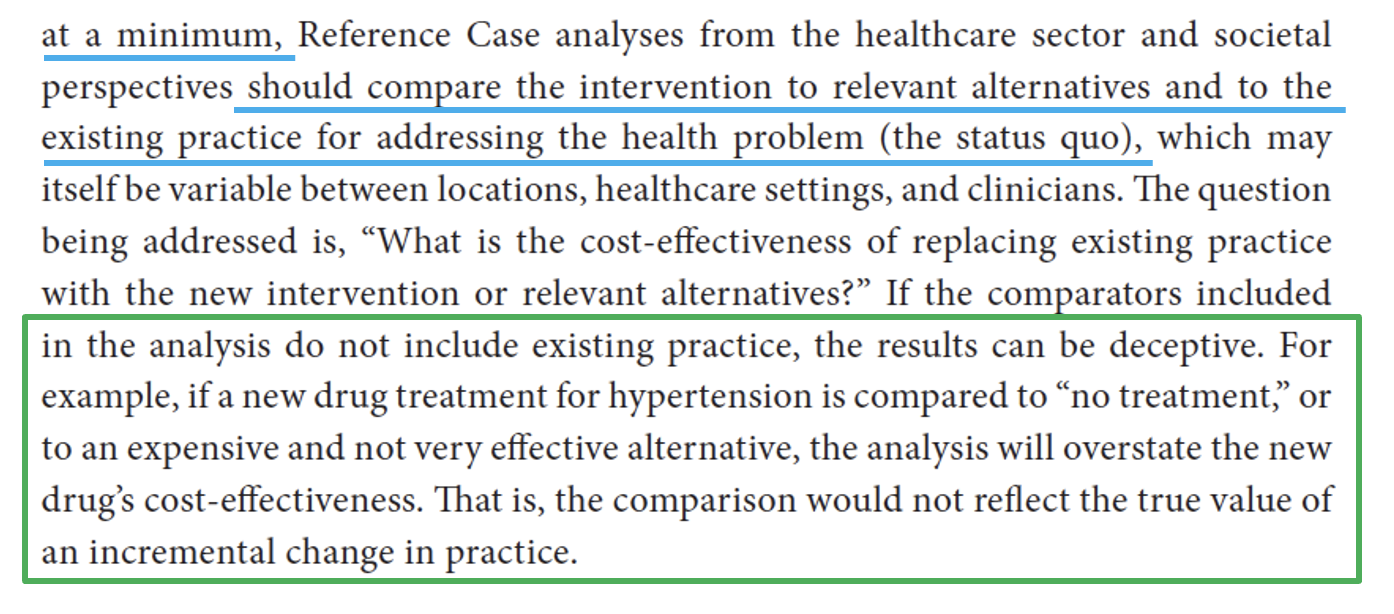
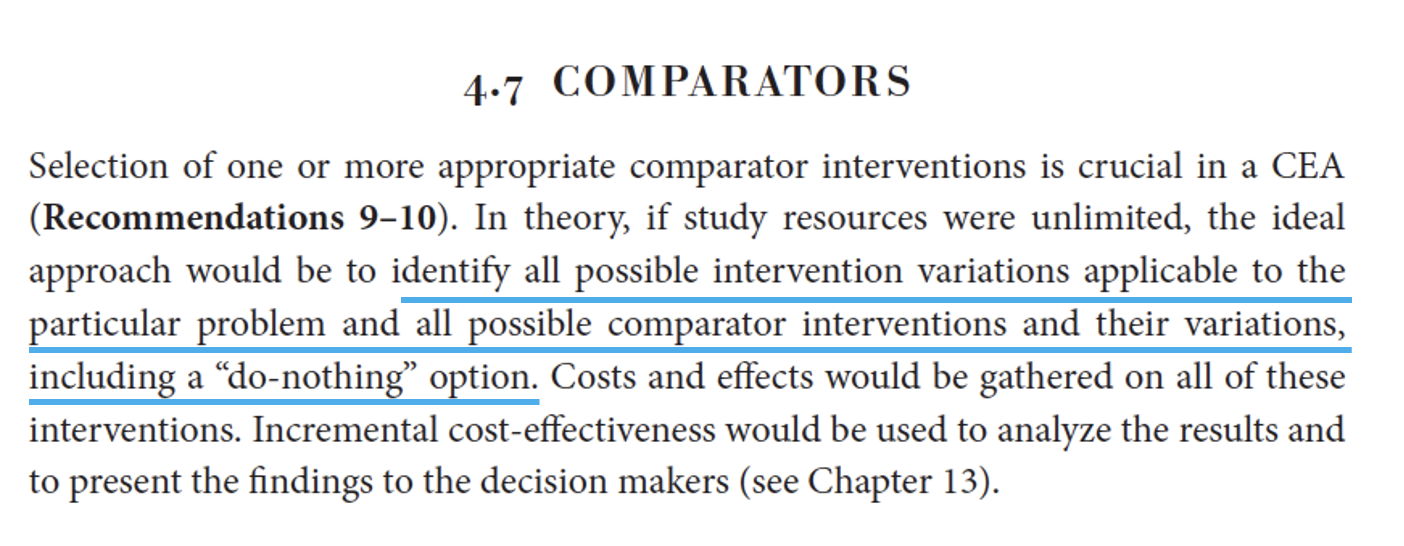
How do CEA Thresholds Guide Decisionmaking?
How do CEA Thresholds Guide Decisionmaking?
How do CEA Thresholds Guide Decisionmaking?
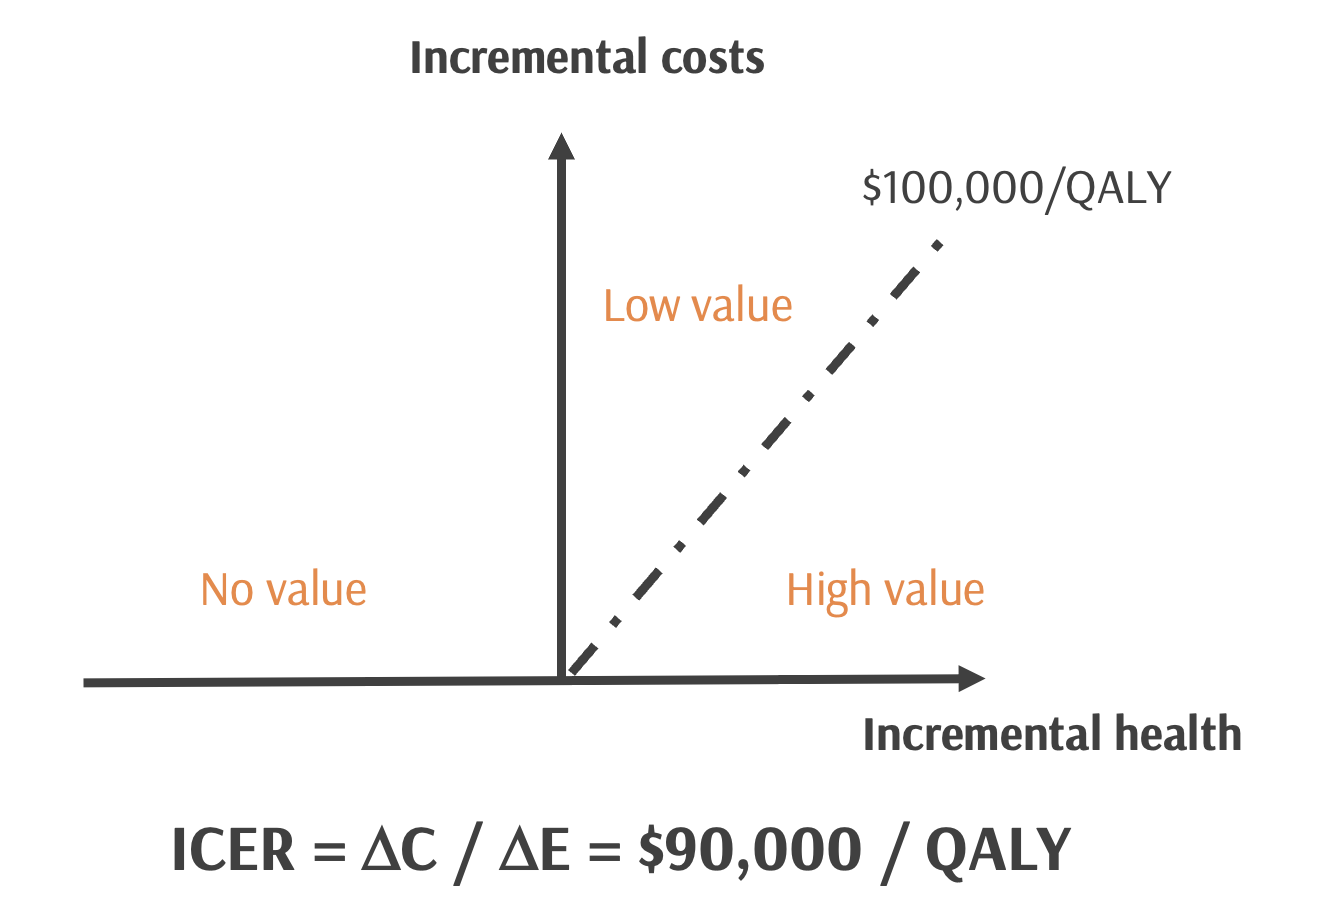
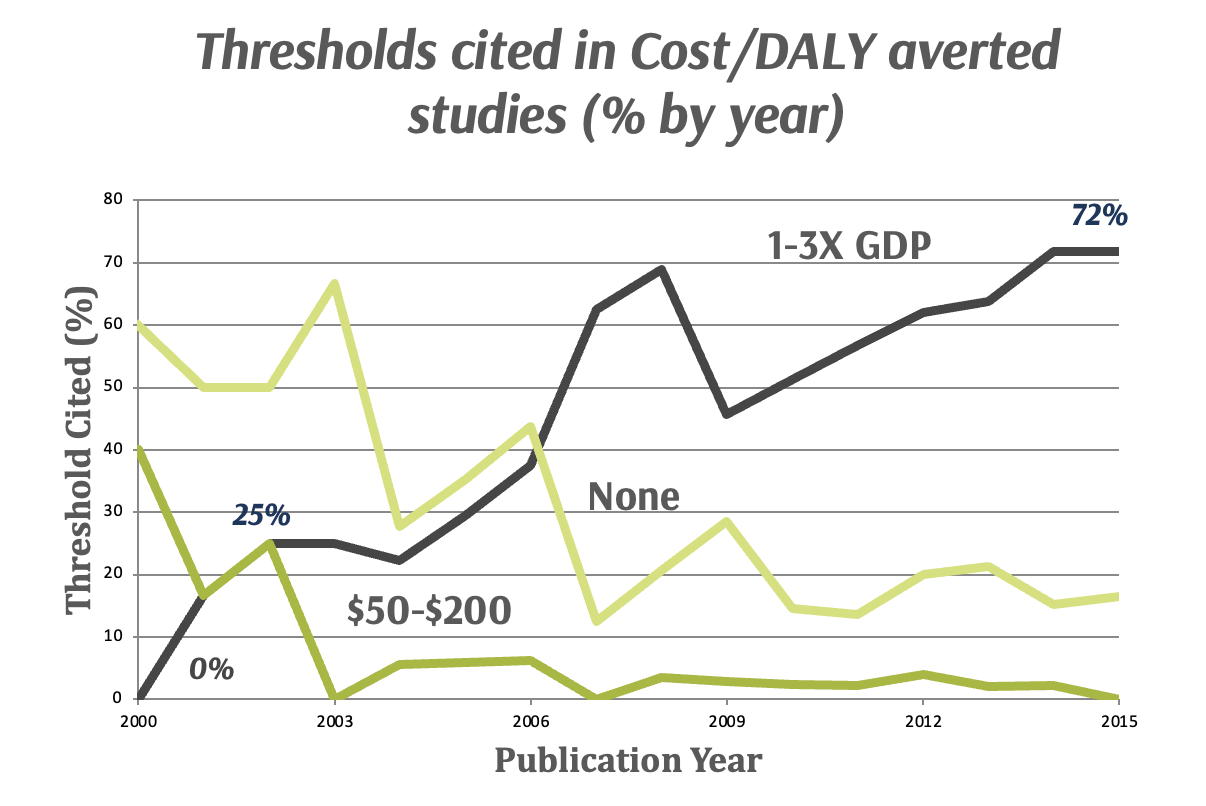
CEA Thresholds
CEA Thresholds
CEA Thresholds
CEA Thresholds

Different ways thresholds have been estimated: - “supply-side” (UK & Europe) - “demand-side” (US) - per capita consumption (US/LMICs)
Opportunity cost (“supply-side”)

Willingness to pay (“demand-side”)

CEA Thresholds in LMICs
CEA Thresholds in LMICs