Case Study - Incremental Cost-Effectiveness Answer
Perform a cost-effectiveness analysis of the treatment options using LYs as the measure of health effects.
Which strategy would you choose and why, if the willingness-to-pay threshold is $100,000 per life year gained?
Step 1: Calculate costs and effects for each strategy.
| Discounted Cost | Discounted Life Years | |
|---|---|---|
| No Screen/Treat | 2,800 | 19.04 |
| Treat all | 30,000 | 19.484 |
| Screen all | 4,950 | 19.68 |
Step 2: Sort table by costs in ascending order (Least Costly to most costly)
| Strategy | Discounted Costs | Discounted LYs | Incremental Costs | Incremental LYs | ICER ($/LY) |
|---|---|---|---|---|---|
| No Screen/Treat | 2,800 | 19.04 | |||
| Screen all | 4,950 | 19.68 | |||
| Treat all | 30,000 | 19.484 |
Step 3a: Calculate the incremental costs and incremental LYs
Remember that we are comparing each strategy to the next cheapest. DO NOT compare all to the baseline.
| Strategy | Discounted Costs | Discounted LYs | Incremental Costs | Incremental LYs | ICER ($/LY) |
|---|---|---|---|---|---|
| No Screen/Treat | 2,800 | 19.04 | |||
| Screen all | 4,950 | 19.68 | 4,950 -2,800 = 2,150 | 19.68 - 19.04 = 0.64 | |
| Treat all | 30,000 | 19.484 | 30,000 - 4,950= 24,050 | 19.484 - 19.68 = -0.196 |
Step 3b: Calculate ICER based on difference in costs and effects.
\[ \frac{C_1 - C_0 \quad (\Delta C)}{E_1 - E_0 \quad (\Delta E)} \]
| Strategy | Discounted Costs | Discounted LYs | Incremental Costs | Incremental LYs | ICER ($/LY) |
|---|---|---|---|---|---|
| No Screen/Treat | 2,800 | 19.04 | |||
| Screen all | 4,950 | 19.68 | 2,150 | 0.64 | 2,150/0.64 = 3,359.375 |
| Treat all | 30,000 | 19.484 | 24,050 | -0.23 | 24,050/-0.196 = -122,704.1 |
Step 4: Determine dominated strategies (ICER<0).
We are looking for strategies with a higher cost and lower utility than the next cheapest strategy.
| Strategy | Discounted Costs | Discounted LYs | Incremental Costs | Incremental LYs | ICER ($/LY) |
|---|---|---|---|---|---|
| No Screen/Treat | 2,800 | 19.04 | |||
| Screen all | 4,950 | 19.68 | 2,150 ⬆︎ | 0.64 ⬆︎ | 3,359.375 |
| Treat all | 30,000 | 19.484 | 24,050 ⬆︎ | -0.23 ⬇︎ | -122,704.1 |
Step 5: Re-calculate ICERs after eliminating dominated strategies.
Since the dominated strategy is the most expensive, we have nothing to recalculate. But remember that we don’t report negative ICERS.
| Strategy | Discounted Costs | Discounted LYs | Incremental Costs | Incremental LYs | ICER ($/LY) |
|---|---|---|---|---|---|
| No Screen/Treat | 2,800 | 19.04 | |||
| Screen all | 4,950 | 19.68 | 2,150 | 0.64 | 3,359.375 |
| Treat all | 30,000 | 19.484 | Dominated |
Step 6: Determine strategies ruled out by extended dominance.
We are looking for the strategies that are not dominated but that have a strategy that is more cost effective than it. To determine these we want to compare the ICER of one strategy with the next most expensive strategy. If the next most expensive strategy has a lower ICER than the comparison strategy is weakly dominated.
In this example, we only have one ICER so there is nothing to compare
| Strategy | Discounted Costs | Discounted LYs | Incremental Costs | Incremental LYs | ICER ($/LY) |
|---|---|---|---|---|---|
| No Screen/Treat | 2,800 | 19.04 | |||
| Screen all | 4,950 | 19.68 | 2,150 | 0.64 | 3,359.375 |
| Treat all | 30,000 | 19.484 | Dominated |
Final: Compare ICERs to WTP
Think of the WTP as a budget. In this example, you have $100,000 to spend. It is not your goal to save any of that money but instead to maximize the amount of health without going over that budget.
In this example, we only have one ICER so there is nothing to compare
| Strategy | Discounted Costs | Discounted LYs | Incremental Costs | Incremental LYs | ICER ($/LY) |
|---|---|---|---|---|---|
| No Screen/Treat | 2,800 | 19.04 | |||
| Screen all | 4,950 | 19.68 | 2,150 | 0.64 | 3,359.375 |
| Treat all | 30,000 | 19.484 | Dominated |
The ICER of $3,359.38/LY is less than $100,000/LY. Therefore, we would say that the Screen All strategy is the most cost-effective with a $100,000 WTP.
Additional Strategies
Another member of the lab has built a model that looks at screening by risk. They were able to provide you the Cost and Life years for two strategies. Include these in your CEA to determine which of the 5 total strategies is the most cost-effective.
Which strategy would you choose and why, if the willingness-to-pay threshold is $100,000 per life year gained?
Step 1: Calculate costs and effects for each strategy.
| Discounted Cost | Discounted Life Years | |
|---|---|---|
| No Screen/Treat | 2,800 | 19.04 |
| Treat all | 30,000 | 19.484 |
| Screen all | 4,950 | 19.68 |
| Screen High Risk Only | 28,000 | 19.89 |
| Treat High Risk Only | 29,000 | 19.91 |
Step 2: Sort table by costs in ascending order (Least Costly to most costly)
| Strategy | Discounted Costs | Discounted LYs | Incremental Costs | Incremental LYs | ICER ($/LY) |
|---|---|---|---|---|---|
| No Screen/Treat | 2,800 | 19.04 | |||
| Screen all | 4,950 | 19.68 | |||
| Screen High Risk Only | $28,000 | 19.89 | |||
| Treat High Risk Only | $29,000 | 19.91 | |||
| Treat all | 30,000 | 19.484 |
Step 3a: Calculate the incremental costs and incremental LYs
Remember that we are comparing each strategy to the next cheapest. DO NOT compare all to the baseline.
| Strategy | Discounted Costs | Discounted LYs | Incremental Costs | Incremental LYs | ICER ($/LY) |
|---|---|---|---|---|---|
| No Screen/Treat | 2,800 | 19.04 | |||
| Screen all | 4950 | 19.68 | 4950-2800=2150 | 19.68-19.04=0.64 | |
| Screen High Risk Only | 28000 | 19.89 | 28000-4950=23050 | 19.89-19.68=0.21 | |
| Treat High Risk Only | 29000 | 19.91 | 29000-28000=1000 | 19.91-19.89=0.02 | |
| Treat all | 30000 | 19.484 | 30000-29000=1000 | 19.484-19.91=-0.43 |
Step 3b: Calculate ICER based on difference in costs and effects.
\[ \frac{C_1 - C_0 \quad (\Delta C)}{E_1 - E_0 \quad (\Delta E)} \]
| Strategy | Discounted Costs | Discounted LYs | Incremental Costs | Incremental LYs | ICER ($/LY) |
|---|---|---|---|---|---|
| No Screen/Treat | 2,800 | 19.04 | |||
| Screen all | 4950 | 19.68 | 2150 | 0.64 | 2150/0.64=3359.38 |
| Screen High Risk Only | 28000 | 19.89 | 23050 | 0.21 | 23050/0.21=109761.9 |
| Treat High Risk Only | 29000 | 19.91 | 1000 | 0.02 | 1000/0.02=50000 |
| Treat all | 30000 | 19.484 | 1000 | -0.43 | 1000/-0.43=-2347.42 |
Step 4: Determine dominated strategies (ICER<0).
We are looking for strategies with a higher cost and lower utility than the next cheapest strategy.
| Strategy | Discounted Costs | Discounted LYs | Incremental Costs | Incremental LYs | ICER ($/LY) |
|---|---|---|---|---|---|
| No Screen/Treat | 2,800 | 19.04 | |||
| Screen all | 4950 | 19.68 | 2150 ⬆︎ | 0.64 ⬆︎ | 3359.38 |
| Screen High Risk Only | 28000 | 19.89 | 23050 ⬆︎ | 0.21 ⬆︎ | 109761.9 |
| Treat High Risk Only | 29000 | 19.91 | 1000 ⬆︎ | 0.02 ⬆︎ | 50000 |
| Treat all | 30000 | 19.484 | 1000 ⬆︎ | -0.43 ︎⬇︎ | -2347.42 |
Step 5: Re-calculate ICERs after eliminating dominated strategies.
Since the dominated strategy is the most expensive, we have nothing to recalculate. But remember that we don’t report negative ICERS.
| Strategy | Discounted Costs | Discounted LYs | Incremental Costs | Incremental LYs | ICER ($/LY) |
|---|---|---|---|---|---|
| No Screen/Treat | 2,800 | 19.04 | |||
| Screen all | 4950 | 19.68 | 2150 | 0.64 | 3359.38 |
| Screen High Risk Only | 28000 | 19.89 | 23050 | 0.21 | 109761.9 |
| Treat High Risk Only | 29000 | 19.91 | 1000 | 0.02 | 50000 |
| Treat all | 30000 | 19.484 | Dominated |
Step 6: Determine strategies ruled out by extended dominance.
We are looking for the strategies that are not dominated but that have a strategy that is more cost effective than it. To determine these we want to compare the ICER of one strategy with the next most expensive strategy. If the next most expensive strategy has a lower ICER than the comparison strategy is weakly dominated.
| Strategy | Discounted Costs | Discounted LYs | Incremental Costs | Incremental LYs | ICER ($/LY) |
|---|---|---|---|---|---|
| No Screen/Treat | 2,800 | 19.04 | |||
| Screen all | 4950 | 19.68 | 2150 | 0.64 | 3359.38 |
| Screen High Risk Only | 28000 | 19.89 | 23050 | 0.21 | 109761.9 (⬆︎ 109761.9 >3359.38) |
| Treat High Risk Only | 29000 | 19.91 | 1000 | 0.02 | 50000 ( ⬇︎50000 <109761.98) |
| Treat all | 30000 | 19.484 | Dominated |
Looks like the “Treat High Risk Only” gets more health at a lower cost ($5,000/LY vs $109,761/LY) “Screen High Risk Only” despite being more expensive.
Therefore, the “Screen High Risk Only” is weakly dominated!
| Strategy | Discounted Costs | Discounted LYs | Incremental Costs | Incremental LYs | ICER ($/LY) |
|---|---|---|---|---|---|
| No Screen/Treat | 2,800 | 19.04 | |||
| Screen all | 4950 | 19.68 | 2150 | 0.64 | 3359.38 |
| Screen High Risk Only | 28000 | 19.89 | 23050 | 0.21 | Weakly Dominated |
| Treat High Risk Only | 29000 | 19.91 | 1000 | 0.02 | 50000 |
| Treat all | 30000 | 19.484 | Dominated |
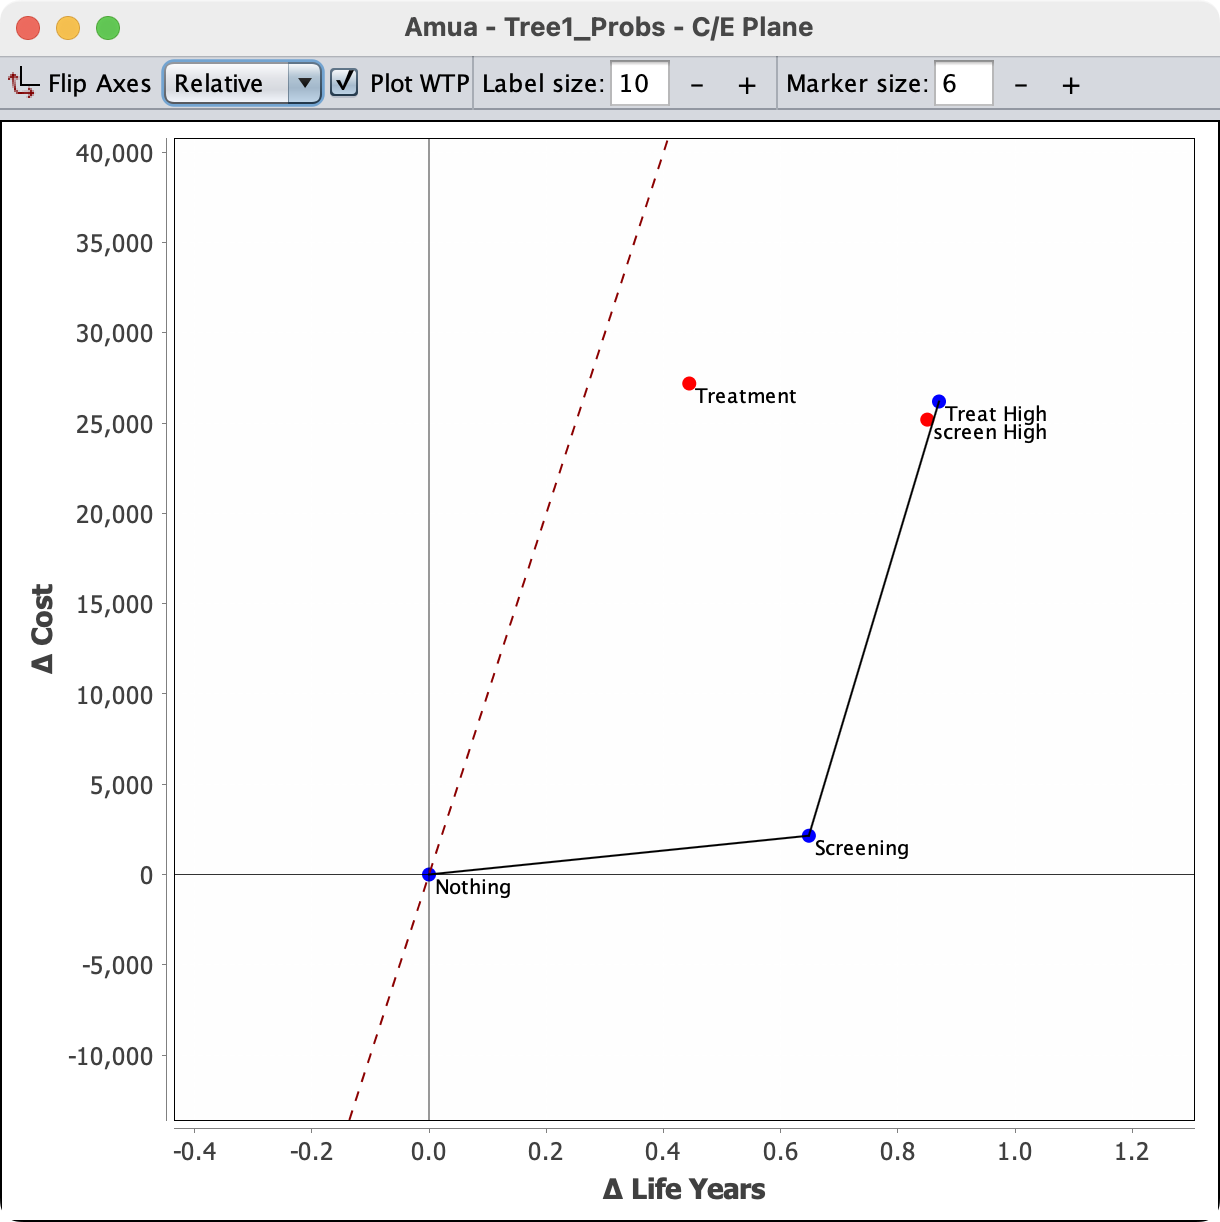
Effectivness Plane
Step 7: Re-calculate ICERs after ruling out all dominated strategies.
| Strategy | Discounted Costs | Discounted LYs | Incremental Costs | Incremental LYs | ICER ($/LY) |
|---|---|---|---|---|---|
| No Screen/Treat | 2,800 | 19.04 | |||
| Screen all | 4950 | 19.68 | 4950-2800=2150 | 19.68-19.04=0.64 | 2150/0.64=3359.38 |
| Treat High Risk Only | 29000 | 19.91 | 29000-4950=24050 | 19.91-19.68=0.23 | 24050/0.23=104565.22 |
| Screen High Risk Only | 28000 | 19.89 | Weakly Dominated | ||
| Treat all | 30000 | 19.484 | Dominated |
Step 8: Repeat 6-7 as needed.
Step 6 Round 2: Determine strategies ruled out by extended dominance.
We are looking for the strategies that are not dominated but that have a strategy that is more cost effective than it. To determine these we want to compare the ICER of one strategy with the next most expensive strategy. If the next most expensive strategy has a lower ICER than the comparison strategy is weakly dominated.
| Strategy | Discounted Costs | Discounted LYs | Incremental Costs | Incremental LYs | ICER ($/LY) |
|---|---|---|---|---|---|
| No Screen/Treat | 2,800 | 19.04 | |||
| Screen all | 4950 | 19.68 | 2,150 | 0.64 | 3,359.38 |
| Treat High Risk Only | 29000 | 19.91 | 24,050 | 0.23 | 104,565.22 (⬆︎ 104,565.22 >3359.38) |
| Screen High Risk Only | 28000 | 19.89 | Weakly Dominated | ||
| Treat all | 30000 | 19.484 | Dominated |
The “Treat High Risk Only” has a higher ICER than the “Screen All” strategy. There are no other ICERs to compare, therefore, we have found all the dominated strategies
Final: Compare ICERs to WTP
Think of the WTP as a budget. In this example, you have $100,000 to spend. It is not your goal to save any of that money but instead to maximize the amount of health without going over that budget.
In this example, we only have one ICER so there is nothing to compare
| Strategy | Discounted Costs | Discounted LYs | Incremental Costs | Incremental LYs | ICER ($/LY) |
|---|---|---|---|---|---|
| No Screen/Treat | 2,800 | 19.04 | |||
| Screen all | 4950 | 19.68 | 2,150 | 0.64 | 3,359.38 |
| Treat High Risk Only | 29000 | 19.91 | 24,050 | 0.23 | 104,565.22 |
| Screen High Risk Only | 28000 | 19.89 | Weakly Dominated | ||
| Treat all | 30000 | 19.484 | Dominated |
The ICER of “Screen All”: $3,359.38/LY is less than $100,000/LY.
The ICER of “Treat High Risk Only”: $104,565.22 /LY is MORE than $100,000/LY.
Therefore, the “Treat High Risk Only” would be “over our budget”.
This means that the Screen All strategy is the most cost-effective with a $100,000 WTP.
Compare ICERs to a $200,000 WTP
Now you have $200,000 to spend. It is not your goal to save any of that money but instead to maximize the amount of health without going over that budget.
In this example, we only have one ICER so there is nothing to compare
| Strategy | Discounted Costs | Discounted LYs | Incremental Costs | Incremental LYs | ICER ($/LY) |
|---|---|---|---|---|---|
| No Screen/Treat | 2,800 | 19.04 | |||
| Screen all | 4950 | 19.68 | 2,150 | 0.64 | 3,359.38 |
| Treat High Risk Only | 29000 | 19.91 | 24,050 | 0.23 | 104,565.22 |
| Screen High Risk Only | 28000 | 19.89 | Weakly Dominated | ||
| Treat all | 30000 | 19.484 | Dominated |
The ICER of “Screen All”: $3,359.38/LY is less than $200,000/LY.
BUT The ICER of “Treat High Risk Only”: $104,565.22 /LY is ALSO less than $200,000/LY.
While there are both cost-effective under the WTP of $200,000/LY, we are trying to get us the MOST health. The “Treat High Risk Only” will give us more health.
This means that the “Treat High Risk Only” strategy is the most cost-effective with a $200,000 WTP.