CaseStudy_decisiontree
Another member of the lab has completed the data collection for you already, you just need to build the model in Amua.
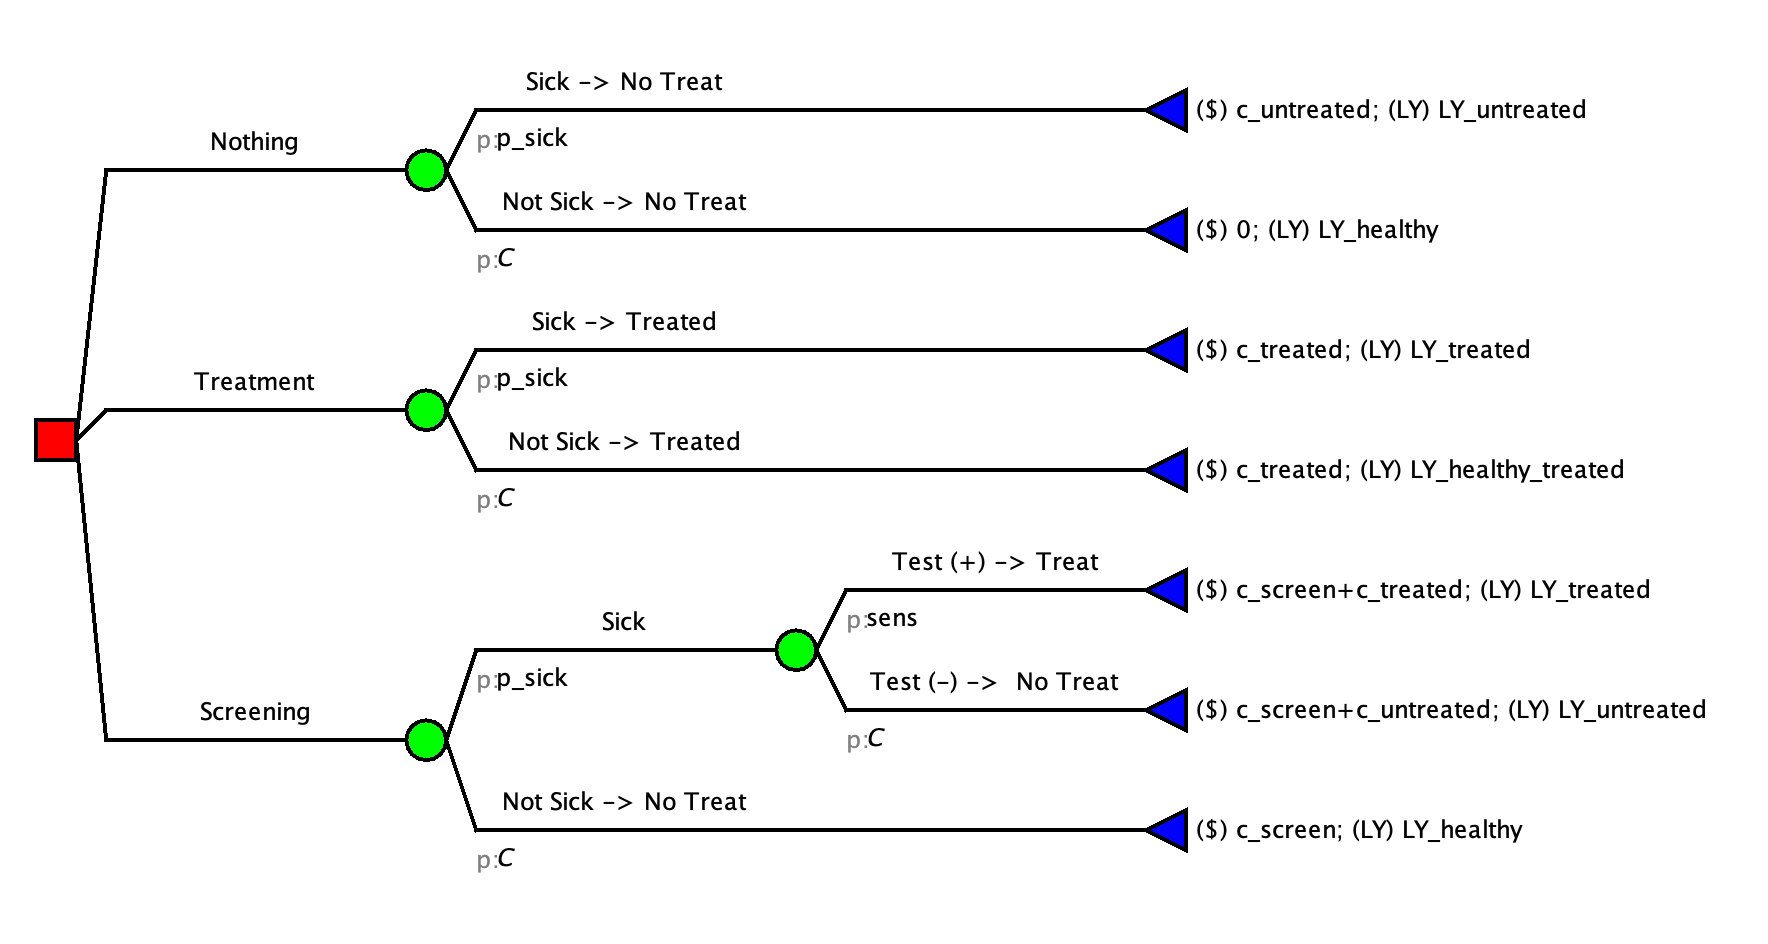
Reminder of Decision Problem
There has been an increase in cases of Disease X within your country and you’ve been assigned to look into methods other countries near by have implemented.
Disease X is a non-communicable disease that mostly effects people in their 50s. There is currently palliative care to help reduce the disease burden for Disease X. You can assume that everyone with Disease X receives this palliative care.
A new out-patient procedure that can treat the disease has started to become popular in surrounding regions. It has a high rate of success. Researchers have also developed a screening method to determine who qualifies for the care. The screening has 100% specificity but only a 90% sensitivity.
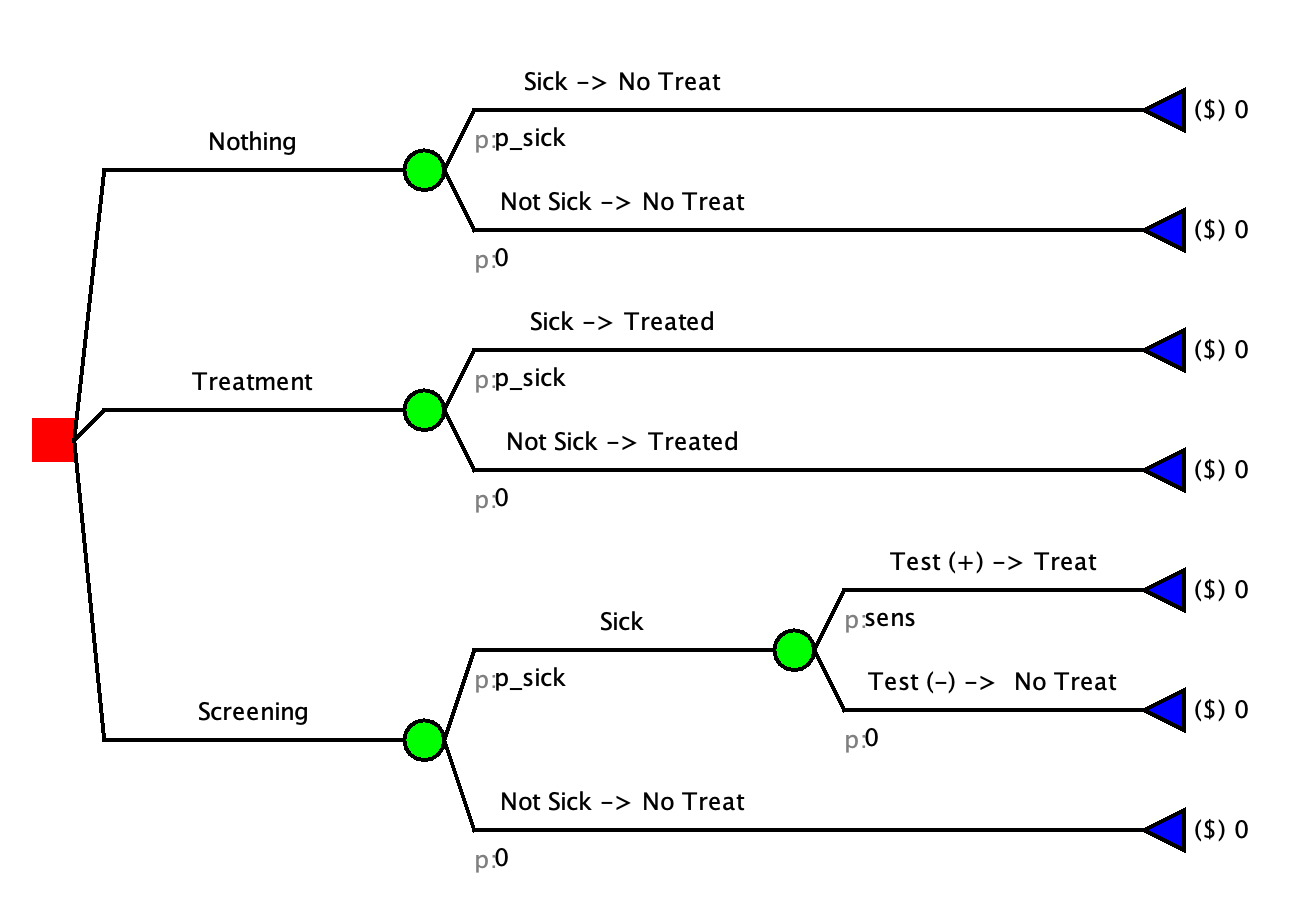
You find that one neighboring country has implemented screening for all (50 year olds) and provides treatment only for those that test positive. Another country has launched a campaign to treat everyone (50 years old) regardless of having the disease. The Ministry of Health has asked us to determine the cost effectiveness of the different strategies.
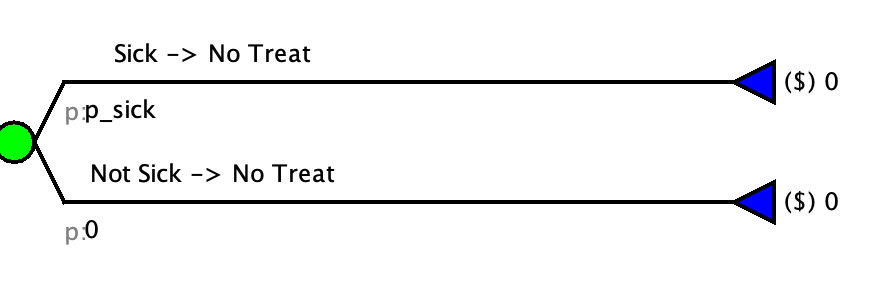
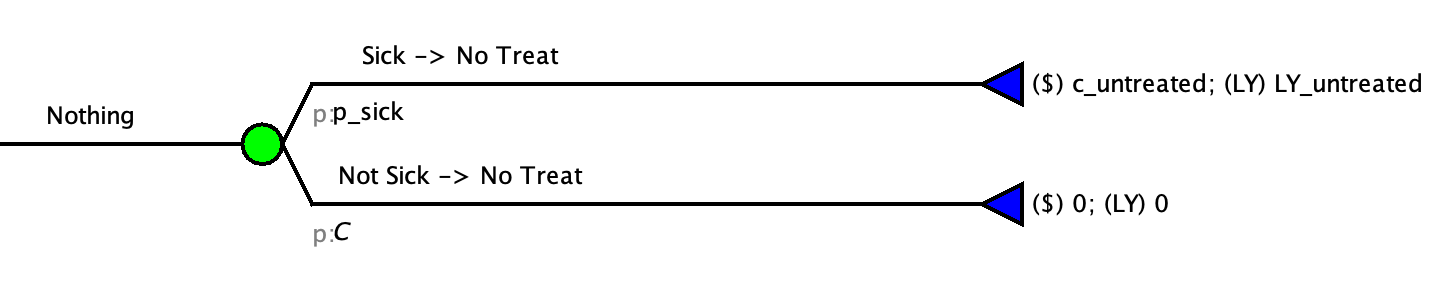
No Screen, No Treat
Screen All, then Treat
No Screen, Treat All
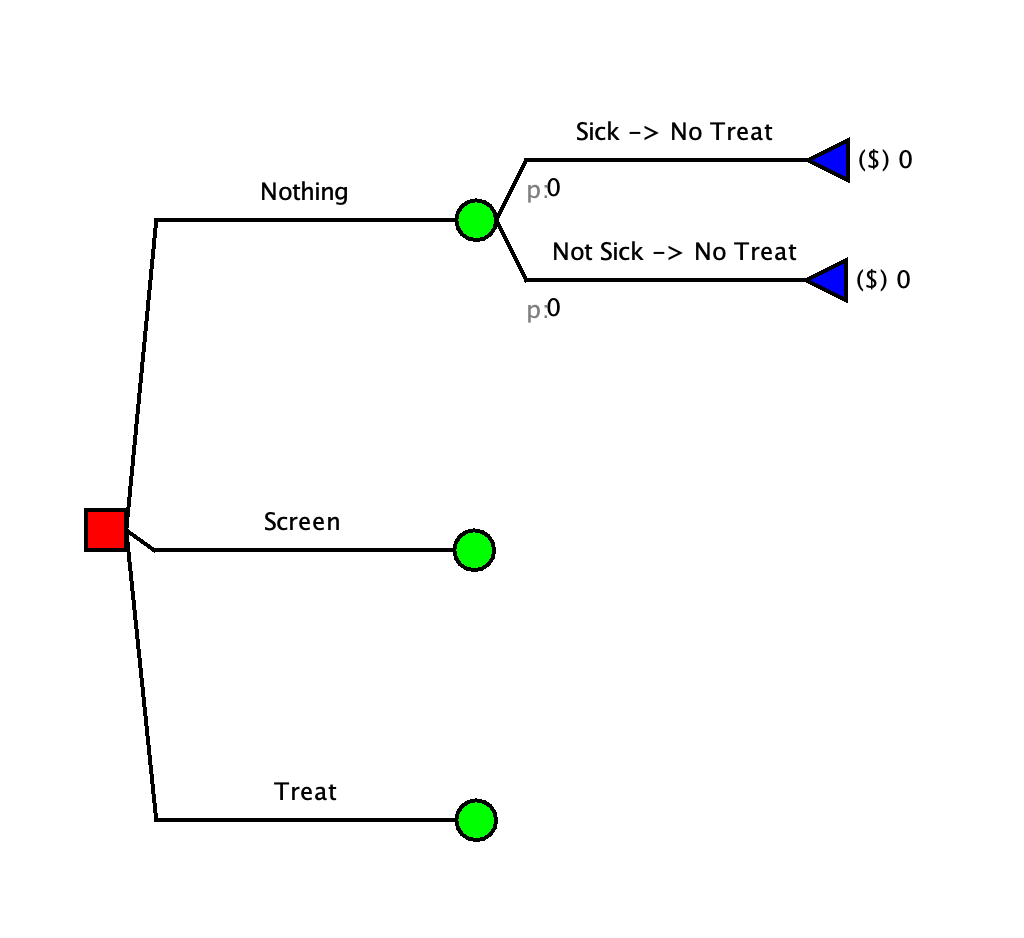
Step 1: Create initial Structure
This is the initial structure of the model that we will build everything from.
You can build it out or download the following document: tree_initial.amua
Step 2: Build Out the Strategies
Treat all strategy
Things to remember when building the strategy out:
- Everyone that is sick will get treatment immediately
More assistance with step
A: Map out the Branches
In the Treatment scenario there are two things that can happen:
You are sick and get treated
You are not sick and get treated
B: Add the Branches
You need to build a branch for each of these
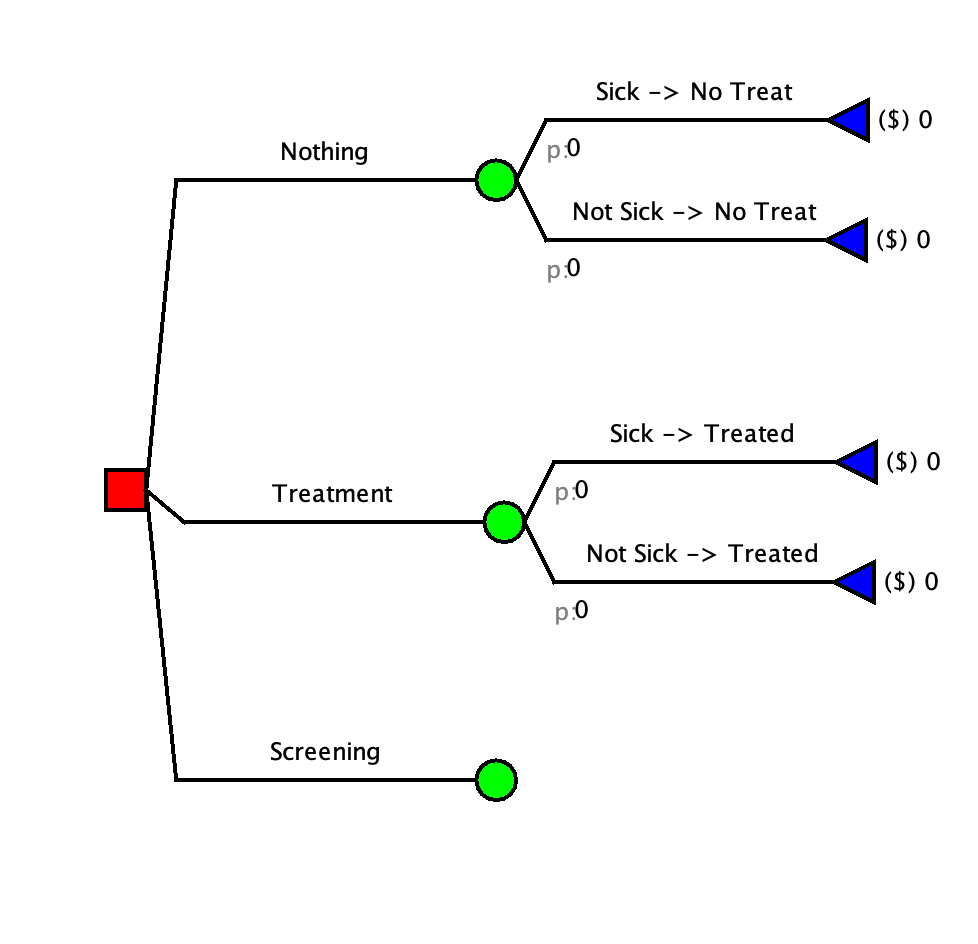
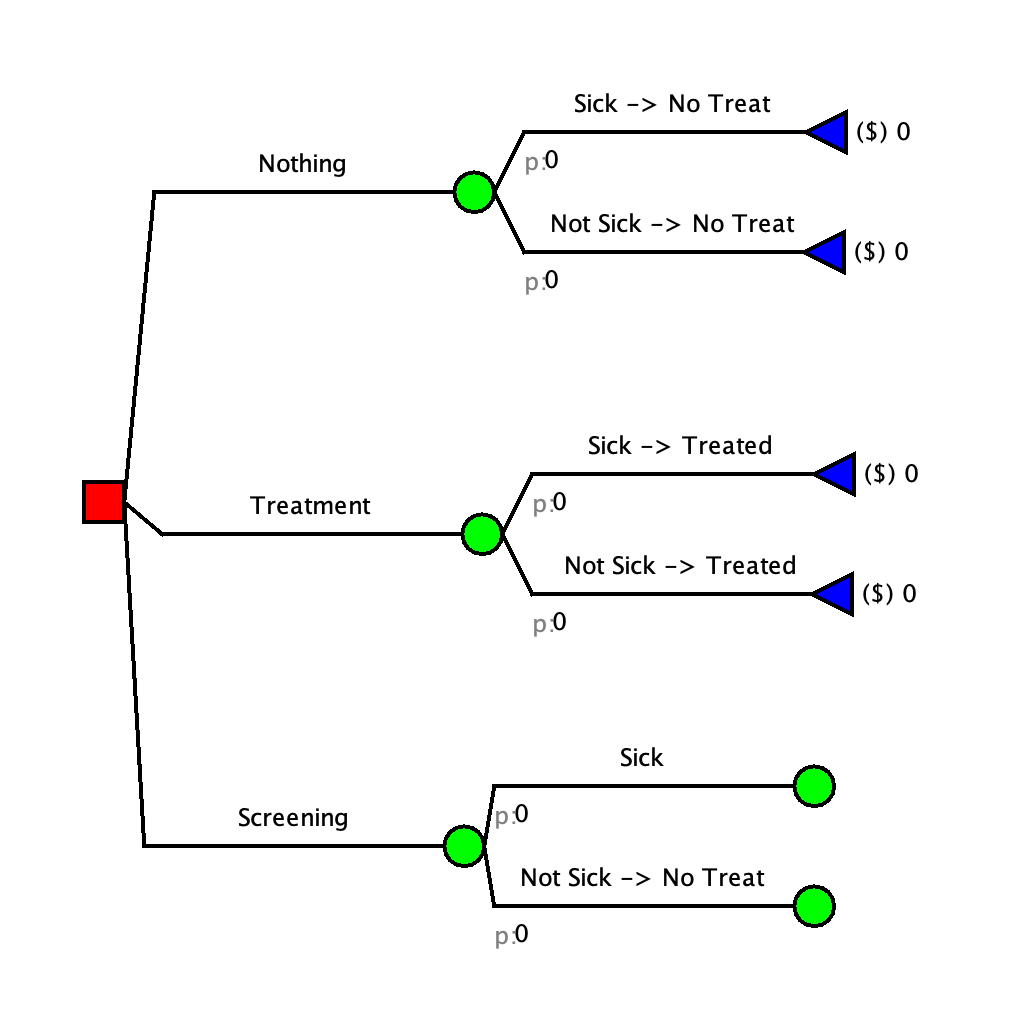
Screen all strategy
Things to remember when building the strategy out:
The specificity is 100% (the test is 100% accurate for individuals that are not sick)
The sensitivity is NOT 100%. Some sick people will get a negative test result.
Only individuals that have a positive screening will get treated
More assistance with step
A: Map out the Branches
In the Screening scenario there are multiple things that can happen:
You get screened, test positive, and ARE sick
You get screened, test negative, and ARE sick
You get screened, test negative, and are NOT sick
You get screened, test positive, and are NOT sick(this is typically an option but in our model the specificity is 100% so this never occurs)
B: Add the Branches
You need to build a branch for each of these. Although the screening happens first, it is typically easier to model the illness status first. The decision tree does not need to be in chronological order (aka it does not need to follow the order that things take place in real life).
We will start by adding the illness status branches.
Now we can add in the test results.
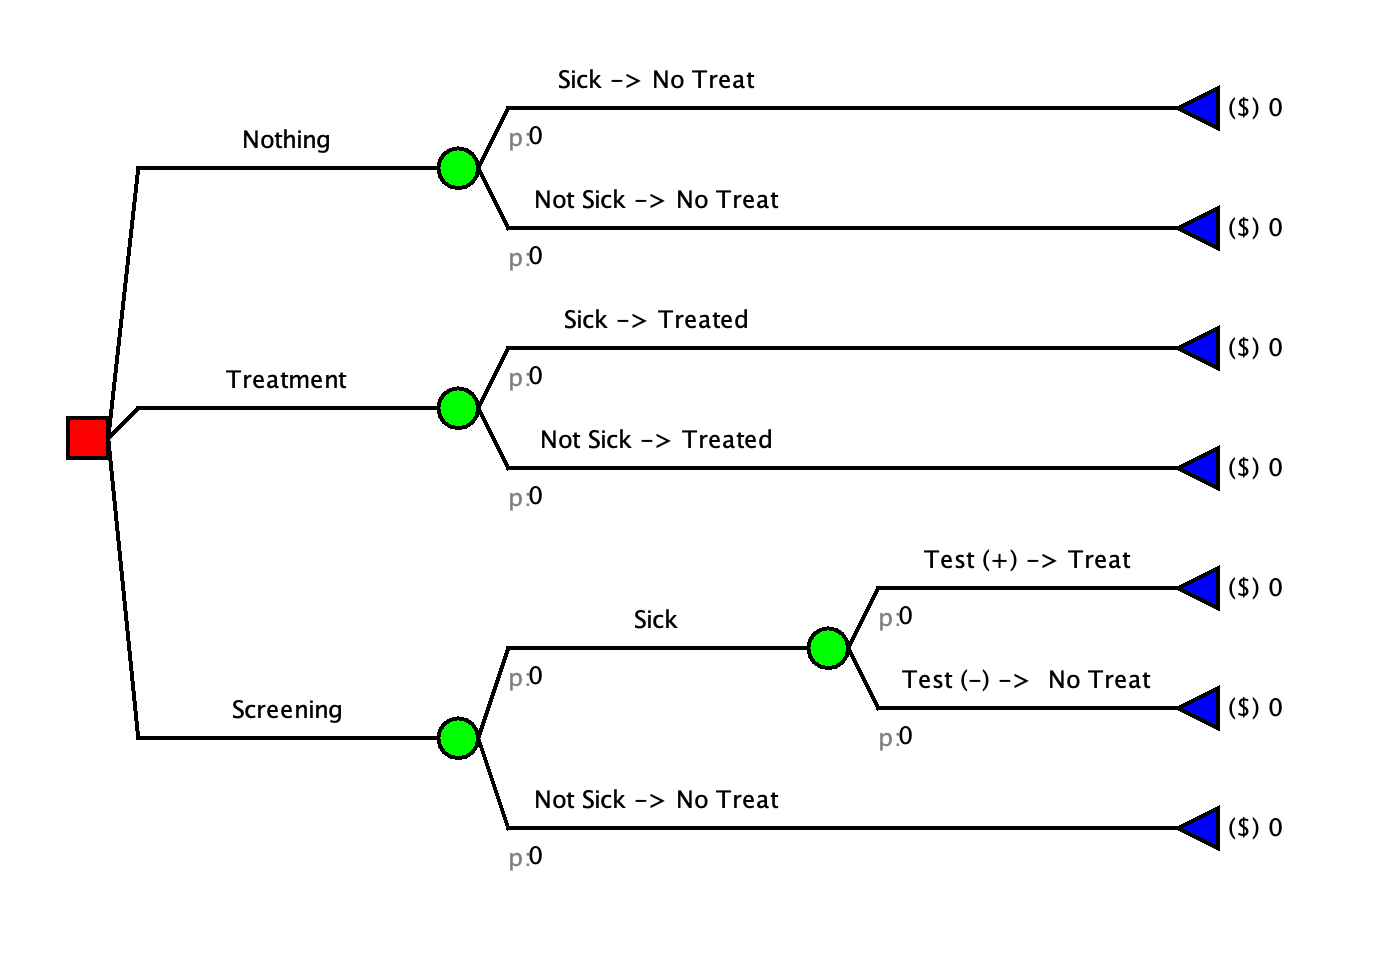
Check your Model
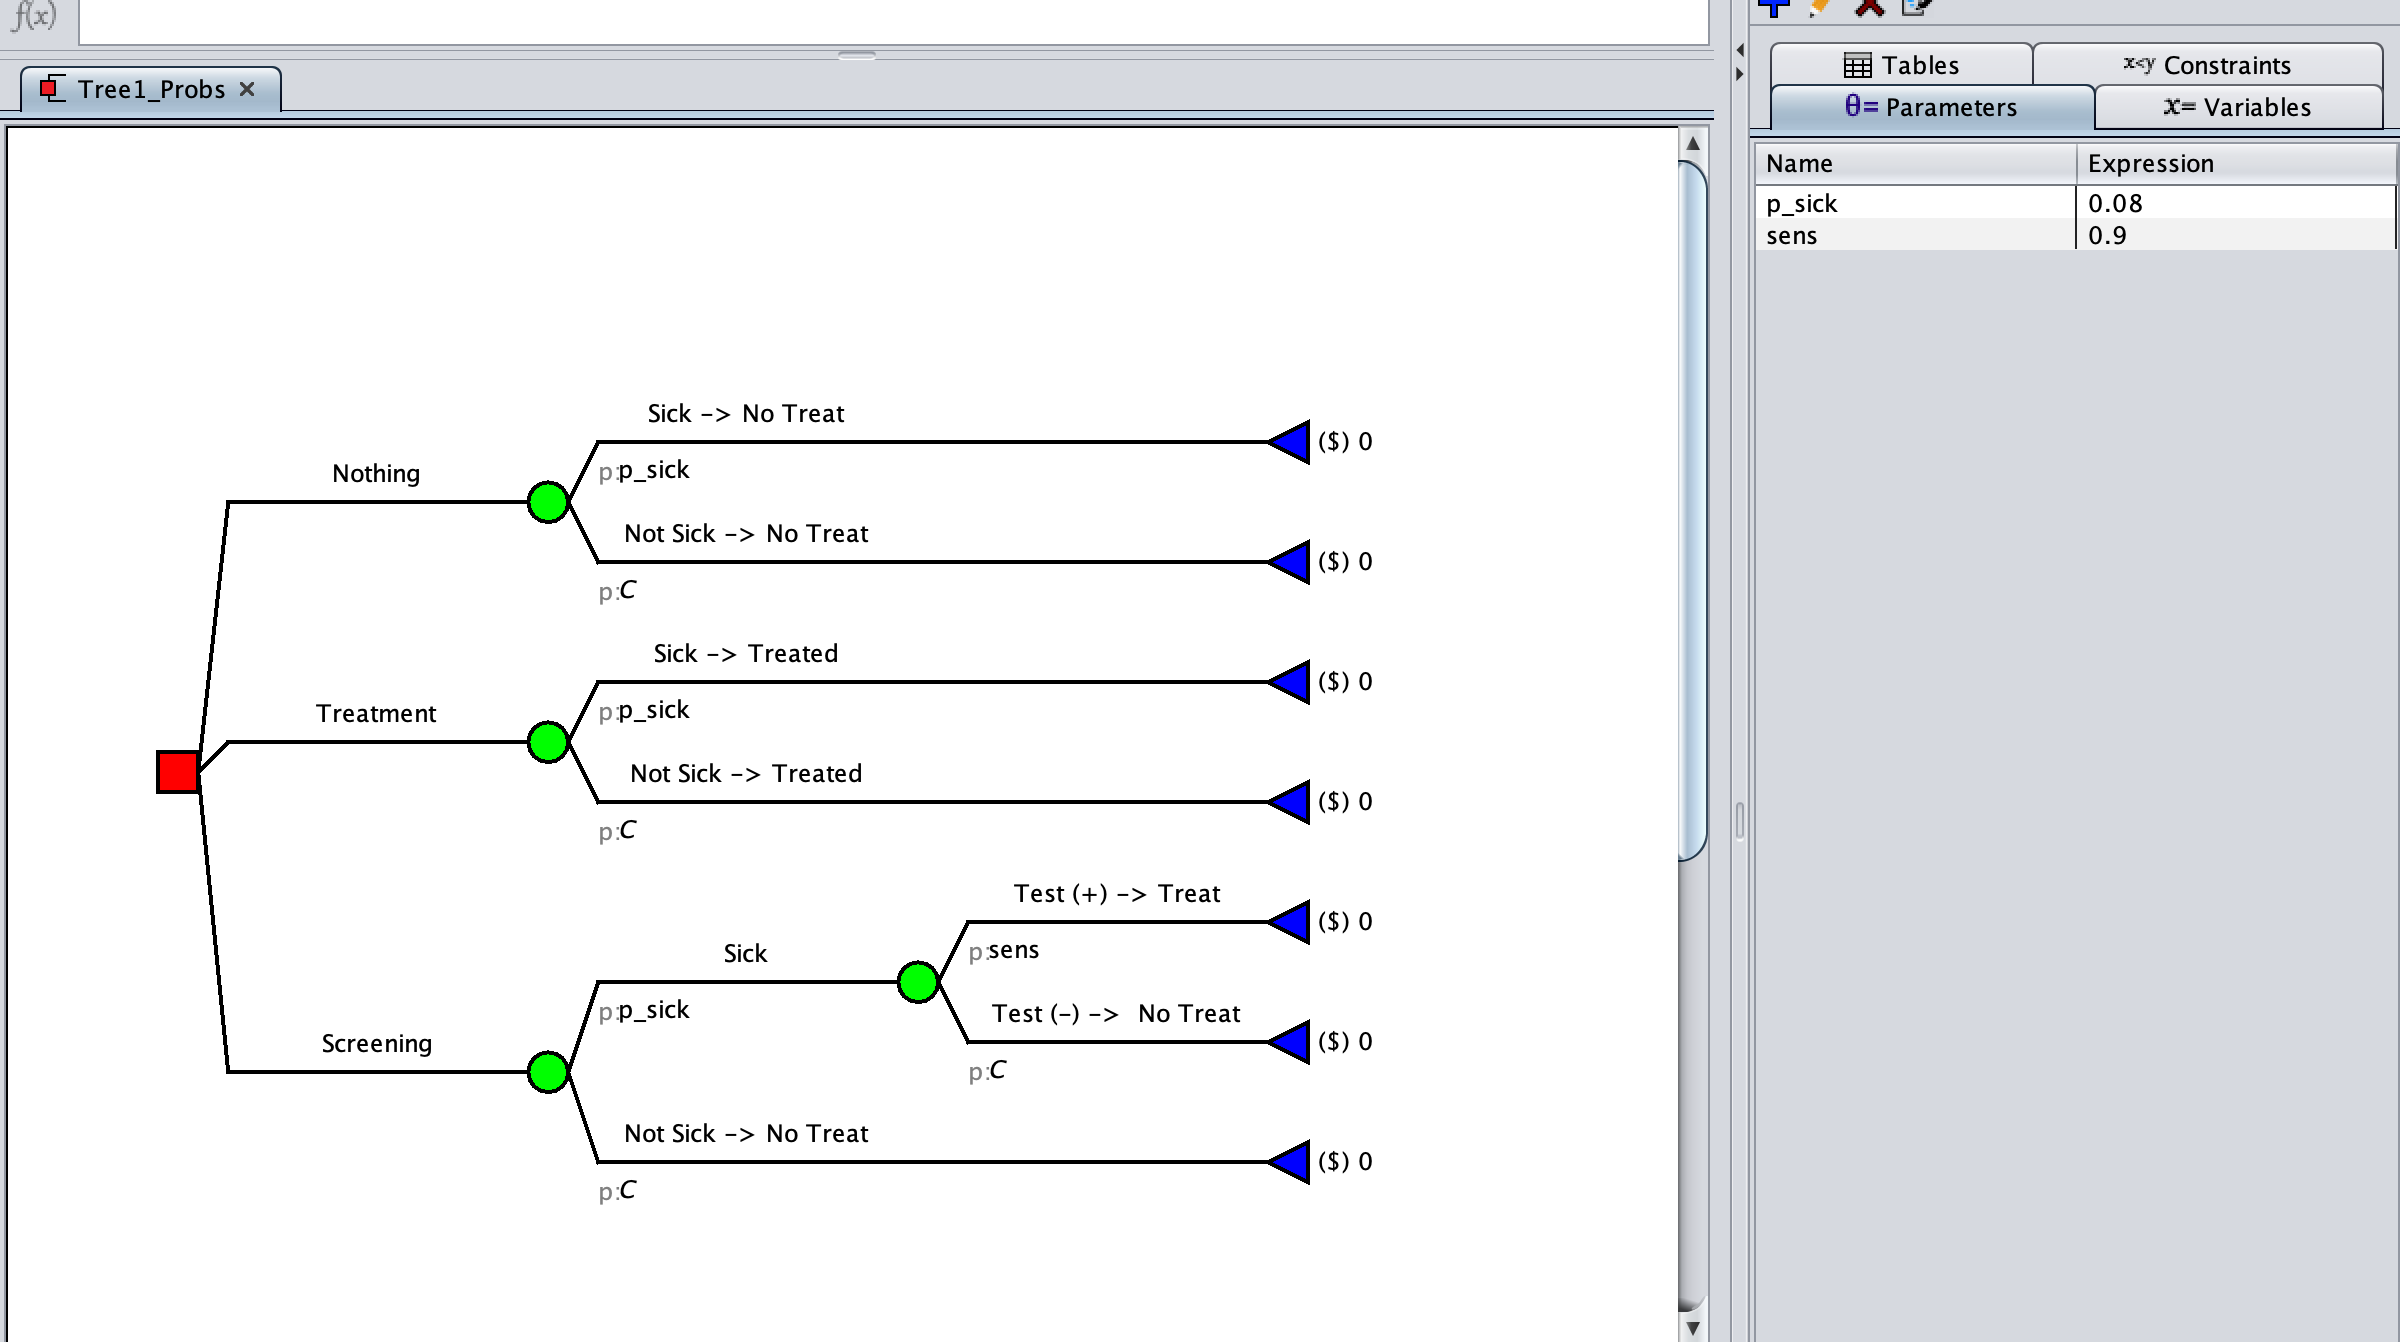
Step 3: Add Probabilities
| Label | Value | Description |
|---|---|---|
| p_sick | 0.08 | Probability of getting sick (Prevelance) |
| sens | 0.9 | Sensitivity of Screening Test |
| spec | 1 | Spesificity of Screening Test |
More assistance with step
A: Add the Probabilities To Amua
You will need to create new parameters for each probability in the table above.
Make sure that you are on the “Parameter” tab of the right side bar
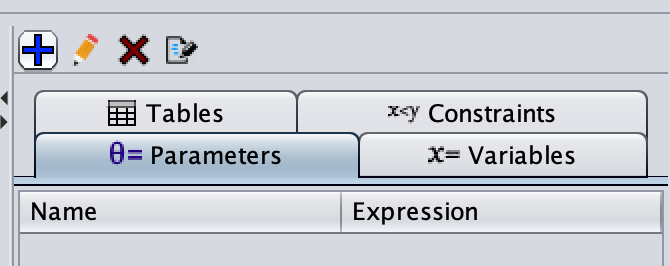
Click on the blue plus sign

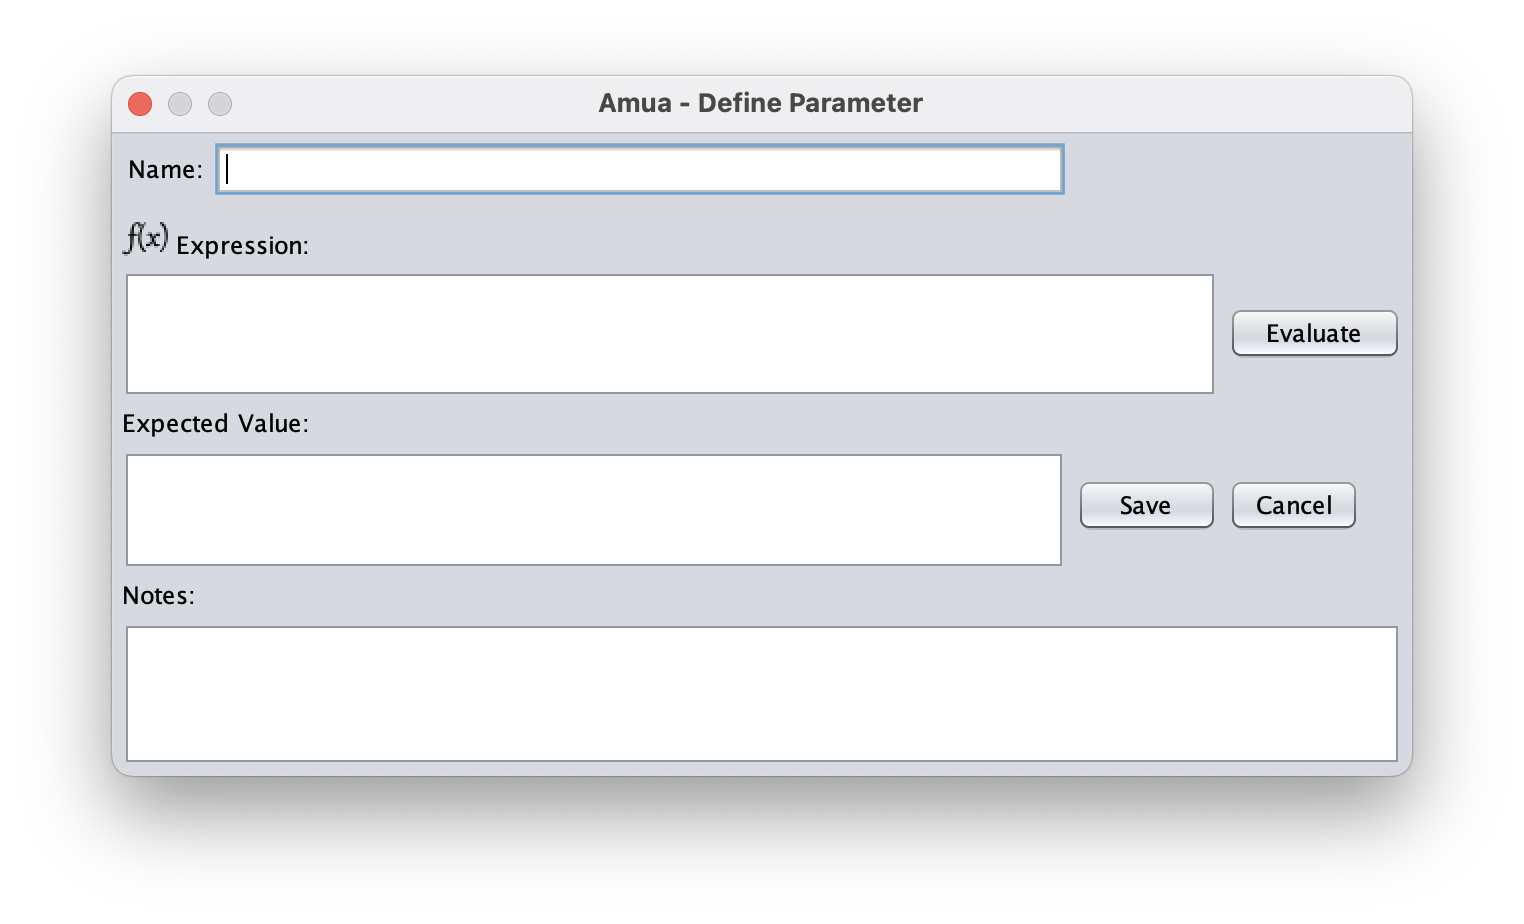
In the pop-up window, enter a parameter name and the parameter value. The description is optional but useful if the model is being shared with others.
Click save and repeat for all parameters.
You should end up with this: 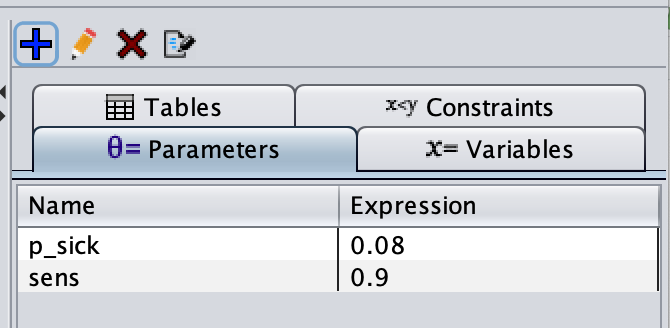
B: Add The Parameters to the branches
The probabilities that we have are:
p_sick: which will go on any branch where someone gets sick sens: which will go on any branch where someone is sick AND tests positive
To add a probability:
1. Click next to the grey “p:” under the branch that you want to edit
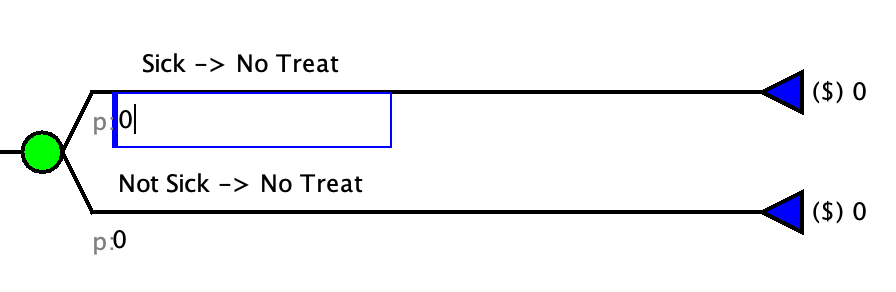
Type the NAME of the parameter you want to add
NOTE: You never want to add the value as it will make the model harder to update later and you will not be able to do sensitivity analysis.
Repeat for all parameters.
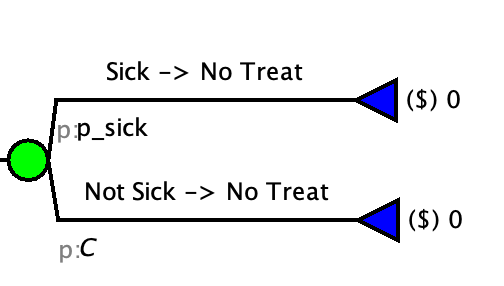
C: Add The Complimentary Probabilities
In Amua, there is a built in variable “C” that will calculate the complementary probability (1-[p of the opposing branch]). You need to add this to all the remaining branches.
Check your Model
Step 4: Add outcomes
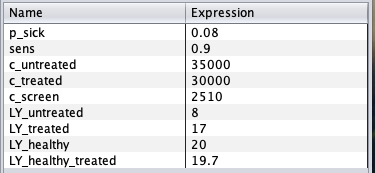
| Label | Value | Description |
|---|---|---|
| c_untreated | $35,000 | Cost of being sick and untreated |
| c_treated | $30,000 | Cost of being treated |
| c_screen | $2,510 | Cost of screening |
| Label | Value | Description |
|---|---|---|
| LY_untreated | 8 | Additional Life Years Gained of being sick and untreated |
| LY_treated | 17 | Additional Life Years Gained of being sick and treated |
| LY_healthy | 20 | Additional Life Years Gained of screening |
| LY_healthy_treated | 19.7 | Additional Life Years Gained to implement screening |
More assistance with step
A: Add the parameters to Amua
You will need to create new parameters for each cost and life years variable in the table above.
Make sure that you are on the “Parameter” tab of the right side bar
Click on the blue plus sign
In the pop-up window, enter a parameter name and the parameter value. The description is optional but useful if the model is being shared with others.
Click save and repeat for all parameters.
You should end up with this:
B: Update the model properties to have both outcomes
On the top menu select “Model” > “Properties”
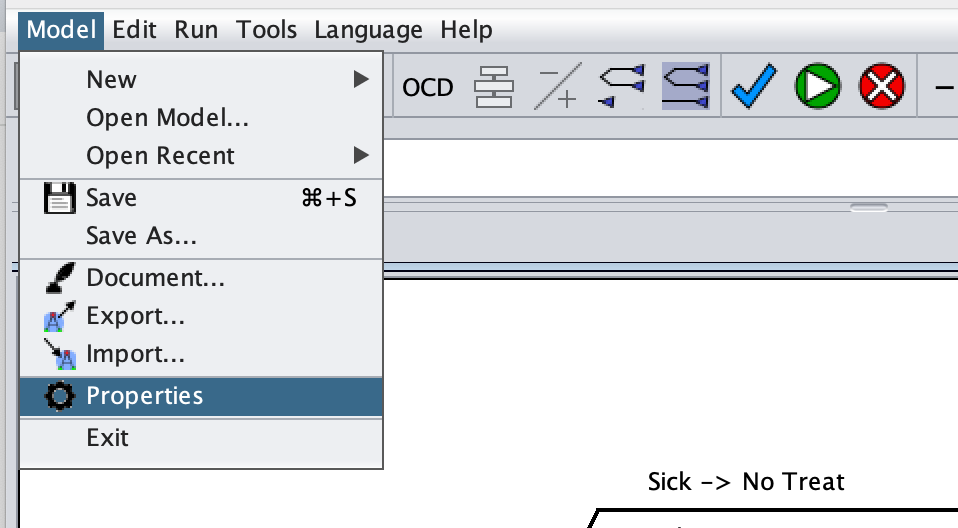
Click to the analysis tab
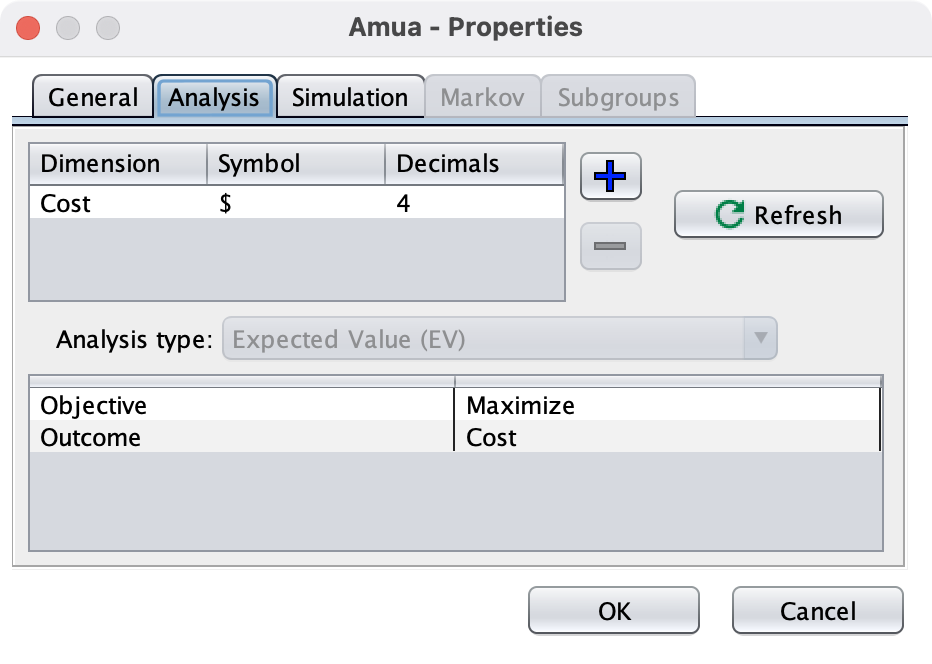
The “Cost” outcome is likely already added. If not, click the blue plus sign
. This will add a new row to the outcomes table
Add a “Dimension” [the name of the variable], a “Symbol” [how you want it to show in the model], and the “Decimals” [number of decimal places you want to show].
Repeat for the “Life Years outcome. You should end up with this:
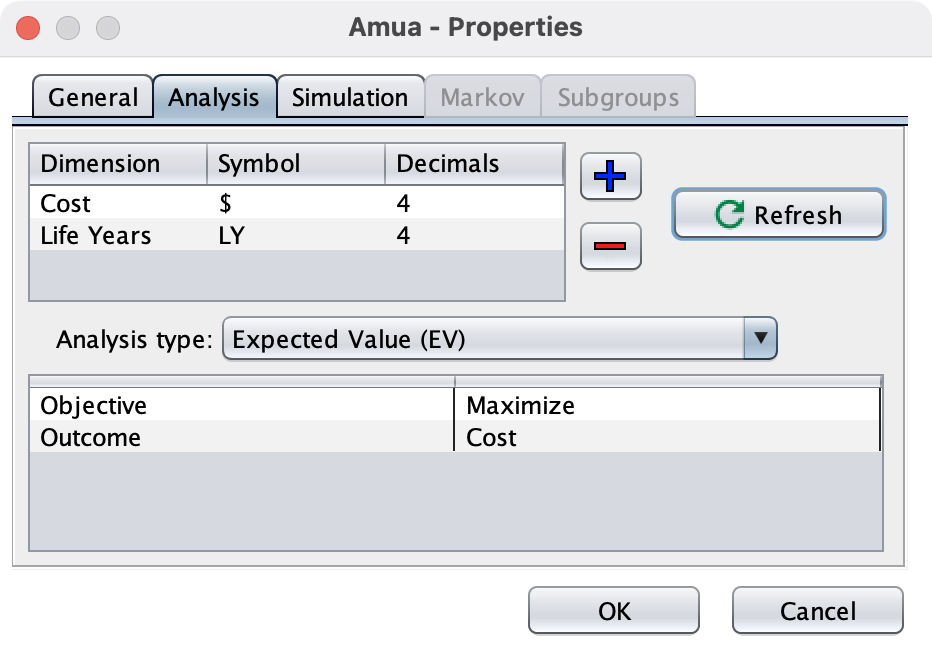
Click the “Refresh Button to update your model

C: Add The Parameters to the branches
At the end of each branch you will need to add the corresponding cost and LY gained outcomes.
To add a probability:
Click on the outcome at the branch that you want to edit
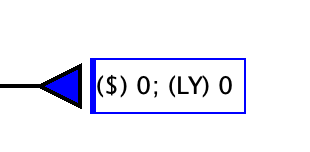
Type the NAME of the parameter you want to add. This can be typed within the model view or at the top in the formula bar
Formula Bar:
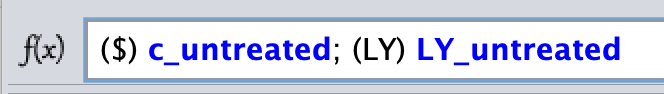
NOTE: You never want to add the value as it will make the model harder to update later and you will not be able to do sensitivity analysis.
- Repeat for all parameters. Hint: Some branches may have multiple costs that need to be summed
Check Your Model
Step 5: Run the Tree
Run the tree ( ) to check your results
Enter your EV($) for the Screening: